Advanced Physics, Dr. Fisher October 2015 The International
advertisement
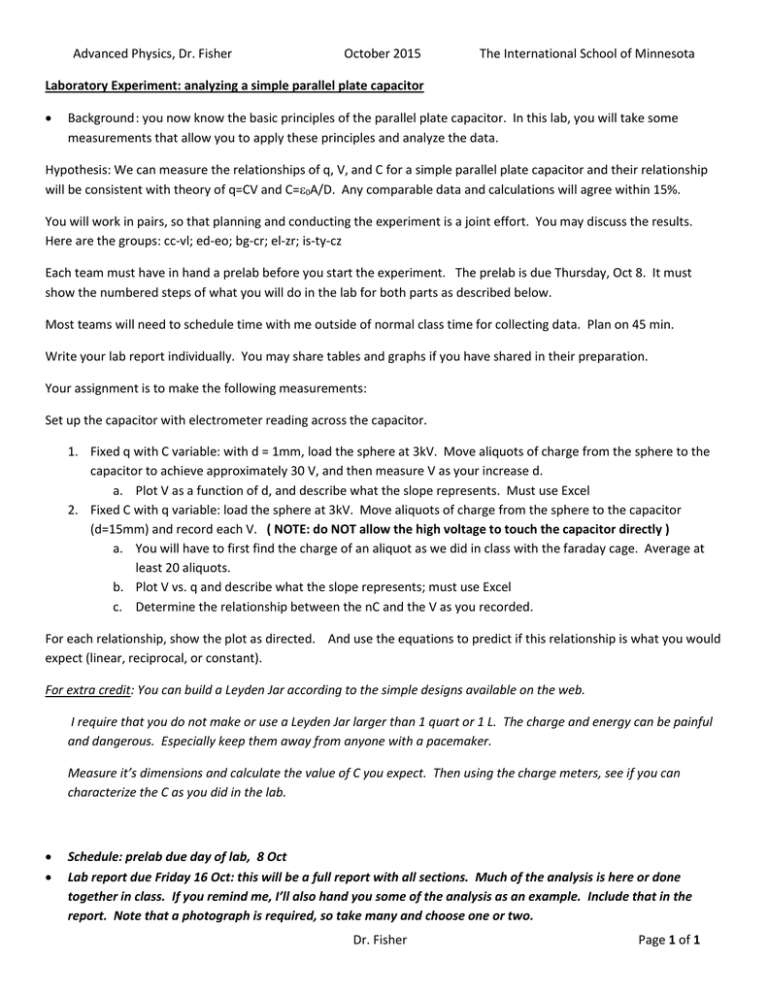
Advanced Physics, Dr. Fisher October 2015 The International School of Minnesota Laboratory Experiment: analyzing a simple parallel plate capacitor Background : you now know the basic principles of the parallel plate capacitor. In this lab, you will take some measurements that allow you to apply these principles and analyze the data. Hypothesis: We can measure the relationships of q, V, and C for a simple parallel plate capacitor and their relationship will be consistent with theory of q=CV and C=0A/D. Any comparable data and calculations will agree within 15%. You will work in pairs, so that planning and conducting the experiment is a joint effort. You may discuss the results. Here are the groups: cc-vl; ed-eo; bg-cr; el-zr; is-ty-cz Each team must have in hand a prelab before you start the experiment. The prelab is due Thursday, Oct 8. It must show the numbered steps of what you will do in the lab for both parts as described below. Most teams will need to schedule time with me outside of normal class time for collecting data. Plan on 45 min. Write your lab report individually. You may share tables and graphs if you have shared in their preparation. Your assignment is to make the following measurements: Set up the capacitor with electrometer reading across the capacitor. 1. Fixed q with C variable: with d = 1mm, load the sphere at 3kV. Move aliquots of charge from the sphere to the capacitor to achieve approximately 30 V, and then measure V as your increase d. a. Plot V as a function of d, and describe what the slope represents. Must use Excel 2. Fixed C with q variable: load the sphere at 3kV. Move aliquots of charge from the sphere to the capacitor (d=15mm) and record each V. ( NOTE: do NOT allow the high voltage to touch the capacitor directly ) a. You will have to first find the charge of an aliquot as we did in class with the faraday cage. Average at least 20 aliquots. b. Plot V vs. q and describe what the slope represents; must use Excel c. Determine the relationship between the nC and the V as you recorded. For each relationship, show the plot as directed. And use the equations to predict if this relationship is what you would expect (linear, reciprocal, or constant). For extra credit: You can build a Leyden Jar according to the simple designs available on the web. I require that you do not make or use a Leyden Jar larger than 1 quart or 1 L. The charge and energy can be painful and dangerous. Especially keep them away from anyone with a pacemaker. Measure it’s dimensions and calculate the value of C you expect. Then using the charge meters, see if you can characterize the C as you did in the lab. Schedule: prelab due day of lab, 8 Oct Lab report due Friday 16 Oct: this will be a full report with all sections. Much of the analysis is here or done together in class. If you remind me, I’ll also hand you some of the analysis as an example. Include that in the report. Note that a photograph is required, so take many and choose one or two. Dr. Fisher Page 1 of 1
![Sample_hold[1]](http://s2.studylib.net/store/data/005360237_1-66a09447be9ffd6ace4f3f67c2fef5c7-300x300.png)
