Lab Report Format Requirements - Tanque Verde Unified School
advertisement
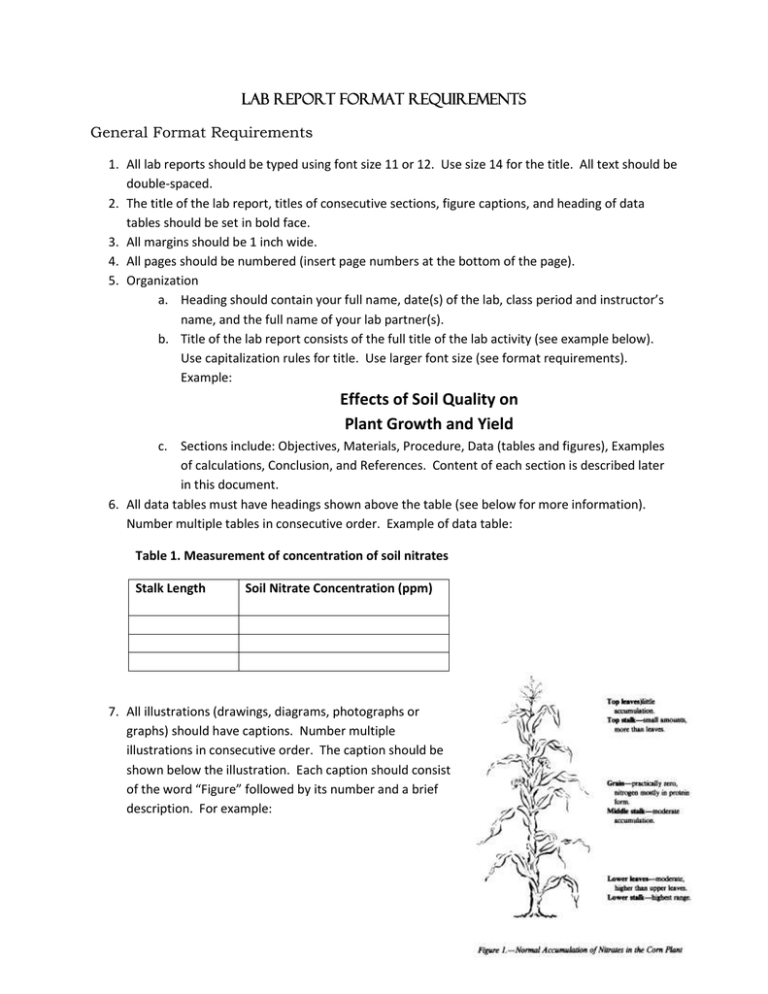
Lab Report Format Requirements General Format Requirements 1. All lab reports should be typed using font size 11 or 12. Use size 14 for the title. All text should be double-spaced. 2. The title of the lab report, titles of consecutive sections, figure captions, and heading of data tables should be set in bold face. 3. All margins should be 1 inch wide. 4. All pages should be numbered (insert page numbers at the bottom of the page). 5. Organization a. Heading should contain your full name, date(s) of the lab, class period and instructor’s name, and the full name of your lab partner(s). b. Title of the lab report consists of the full title of the lab activity (see example below). Use capitalization rules for title. Use larger font size (see format requirements). Example: Effects of Soil Quality on Plant Growth and Yield c. Sections include: Objectives, Materials, Procedure, Data (tables and figures), Examples of calculations, Conclusion, and References. Content of each section is described later in this document. 6. All data tables must have headings shown above the table (see below for more information). Number multiple tables in consecutive order. Example of data table: Table 1. Measurement of concentration of soil nitrates Stalk Length Soil Nitrate Concentration (ppm) 7. All illustrations (drawings, diagrams, photographs or graphs) should have captions. Number multiple illustrations in consecutive order. The caption should be shown below the illustration. Each caption should consist of the word “Figure” followed by its number and a brief description. For example: 8. Proof-read and check your report for spelling and grammar errors, typos and other mistakes. Also, verify that all parts are present in the correct order. If submitting a printed version of a lab report, staple all pages in order. 9. Self-evaluate your report using the rubric provided in class. 10. Graded laboratory reports should be printed and stored in a folder together with instructions for each lab. Sections of the Laboratory Report Objectives Briefly state the purpose of the lab. Use a bulleted list if there are multiple objectives. Make sure that the main goal of the lab is explained in complete sentences. If you have an hypothesis, include it in this section . Materials List all materials used in the lab. If the list is very long, format this section using columns or make a table with two columns but do not display the grid. Separate equipment from any chemicals/solutions. Procedure If you have been provided with a procedure, then describe it very briefly in paragraph form, noting the most important parts of the procedure (DO NOT copy the exact procedure from the lab protocol, and do not list the steps with numbers). If you have you have developed your own procedure, you must describe it. Your procedure should be written as a series of steps. Be specific and give all details, such as sizes of containers, amounts used, etc. Make an illustration of your setup, and refer to it in your procedure. If you have been provided with the written procedure but modified it in the course of the experiment, all of the modifications should be described in this section. If necessary, provide a drawing and refer to it. Data This section consists of tables and graphs. All numerical (quantitative) data collected during the experiment should be shown in a data table. Each data table (even if there is just one) must have a heading. In a more complex experiment, more than one data table will be needed. As a general rule, all information collected during the lab should be presented separately from calculations done later. You should format your table in such a way that multiple trials can fit across the page. If averages are calculated, the average and spread of values should be reported in the same data table. Figures (graphs) illustrating your data or trends developed using your data should follow data tables. If the graph shows a trend (best-fit line) then you should state the equation, indicating the type of the relationship (direct, inverse). Generally, for multiple trials showing the same trend, one figure is sufficient. If your data was in any way modified (for example, a correction was applied), and a new type of graph was generated, then you should show that new graph as well. Graphs must have properly formatted axes, showing their quantities and their units. If more than one set of data is shown in a graph, then a legend (key) should be provided. Before submitting your report you should verify that all information is readable (that is, your lines are shown clearly in the printout). Examples of Calculations In this section you must show one example of each calculation performed during the lab. Your calculations should be annotated; that is, you should explain what is being calculated. For example, if the data table shows determination of density calculated from mass and volume for multiple trails, average result and percent error, then below the data table you should have the following information: Density is calculated using a formula: o Density = mass/volume (D = m/V) In trial 1: D = 34.59 g/35.5 mL = 0.974 g/mL Average density for 3 trials: (0.974 + 0.993 + 1.02)/3 = 0.996 g/mL Percent error calculations: o Percent error = (|measured value – expected value|/expected value) x 100% From information provided in the procedure, density of water at 25⁰C is 0.997 g/mL (|0.996-0.997|/0.997)x100% = 0.100% Note that in all of your calculations, you should have units and use proper significant figures. If more complex equations are used in the calculations, you might consider using an equation editor in your word processing program. Whenever possible, you are encouraged to use a spreadsheet program to assist you in calculations during a lab. You can later use your spreadsheet to produce a data table(s) for the final laboratory report. However, you should pay attention to formatting cells in the spreadsheet to ensure that all text is shown properly, and that the numerical values are formatted using the correct number of significant figures. Conclusions This is the most important part of your report. Poorly written conclusions will lower your grade significantly. Writing good conclusions requires some time spent thinking about your data and discussing it with other people in class. Conclusions consist of five sections written as paragraphs: (1) introduction with background information, (2) description of procedure, (3) description of results, (4) discussion of errors and their sources, and (5) explanation including ideas on application and improvements. The first paragraph provides an introduction and background on the experiment. In addition to the information about the people who performed the lab, its place, time and duration, MOST IMPORTANTLY, it should explain the purpose of the lab. Use your textbook, class notes, lab handout/manual and other resources to write this section (cite all resources in MLA format in the References section). You should be able to explain in your own words why this lab was done. For example, if you are measuring density, you should define this term, and explain why this property is important. In the second paragraph, you should restate the main parts of the procedure in a narrative format. Avoid colloquial terms (e.g. “nowadays,” sort of,” “kind of,” “just a little,” etc.) and be as descriptive as possible, so someone reading this part could reconstruct the experiment in exactly the same way. Explain how many trials were done and provide any other information that is essential to understand how the experiment was performed. If multiple techniques were utilized to determine the same quantity, both must be explained. In the third paragraph you will describe your results. You should be referring to data tables and figures all the time, quoting actual values. For example: Our determinations of density of water, shown in Table 1, ranged from 0.974 g/mL to 1.02 g/mL, with an average of 0.996 ± 0.023 g/mL. The class averages, shown in Figure 1 and Table 2, ranged from 0.990 g/mL to 1.05 g/mL, with an average of 0.999 ± 0.030 g/mL. According to the information provided, the density of water at 25⁰C is 0.997 g/mL. If you have used different approaches (methods) then compare the results obtained through each technique. For example, your determinations of density from repeated measurements of mass and volume should be compared with the result obtained graphically. Logically explain how your measurements lead to the results. In the fourth paragraph, you should fully discuss any errors associated with your measurements and their possible sources. This section should include information on accuracy and precision. For example: The percent error for our group determination was 0.1%, whereas the percent error for the class average was 0.200%. Both results are very close to the expected value but percent error for our group determination is smaller and therefore, our group determination was more accurate. From the spread of data points, we conclude that our group precision was better than the precision of the whole class. Each time you suspect an error, try to evaluate how your result was affected by that error. Be specific! For example: Our measurements of a density of a solid in trials 1, 2, and 3 were smaller than the expected value. The possible sources of errors could be due to small bubbles of air that adhered to particles of the solid in the graduated cylinder. Due to the presence of bubbles of air, the total volume of the solid measured would be higher than the real volume, and as a result, the calculated density would be too small. In trial 6 and 8, our determinations were higher than the expected value. The reason for that could be […]. Explain how these errors can be avoided by modifying the procedure. Note: The mistakes in measuring of mass, volume, temperature, counting of droplets, etc., are not valid sources of error. If you suspect that a mistake was made during the experiment (in one or more trials), then you should explain that in the earlier paragraph. Remember that even ‘bad’ data must be reported in the data table, however, you should not include the erroneous measurements in calculations of averages. Naturally, you should have repeated the experiment a sufficient number of times after the mistake was identified. The content of the fifth paragraph will vary depending on the type of the experiment. If you were observing an unknown phenomenon, to the best of your ability try to explain it. Make suggestions on how this phenomenon could be researched further, and provide an outline of another experiment. If you were conducting an experiment to measure a quantity, or conducting some type of analysis (such as pH readings), you should discuss additional applications of this type of activity and improvements. This section will likely require doing some research. References All sources of information must be listed in appropriate MLA format in this section
