Normal Distribution
advertisement
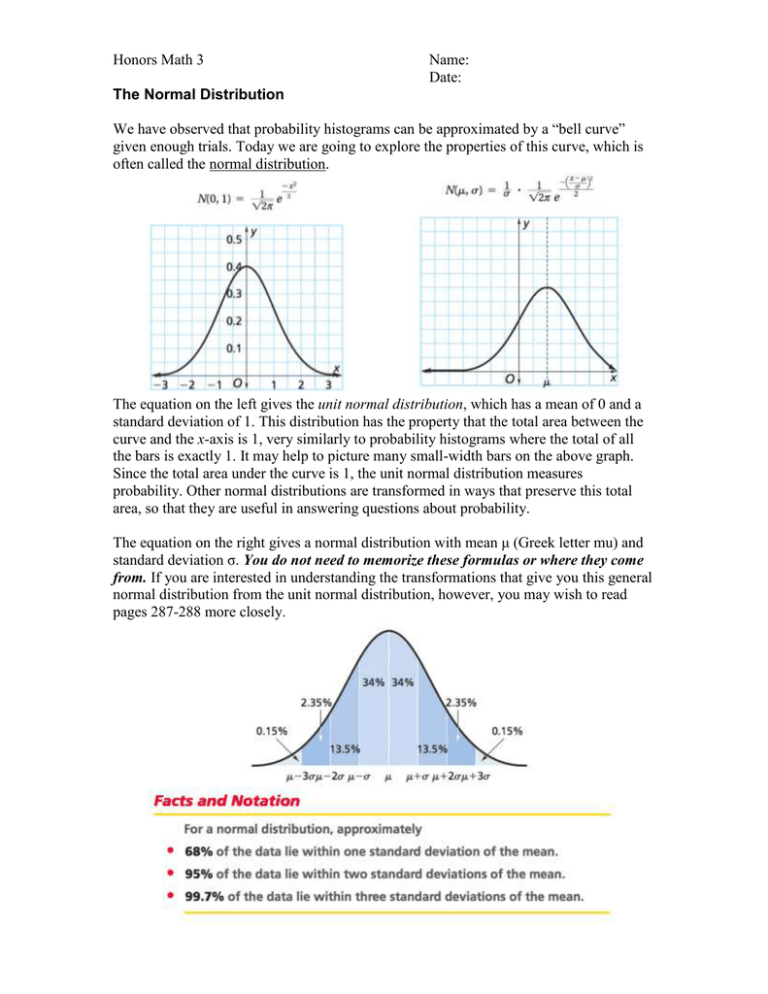
Honors Math 3 Name: Date: The Normal Distribution We have observed that probability histograms can be approximated by a “bell curve” given enough trials. Today we are going to explore the properties of this curve, which is often called the normal distribution. The equation on the left gives the unit normal distribution, which has a mean of 0 and a standard deviation of 1. This distribution has the property that the total area between the curve and the x-axis is 1, very similarly to probability histograms where the total of all the bars is exactly 1. It may help to picture many small-width bars on the above graph. Since the total area under the curve is 1, the unit normal distribution measures probability. Other normal distributions are transformed in ways that preserve this total area, so that they are useful in answering questions about probability. The equation on the right gives a normal distribution with mean μ (Greek letter mu) and standard deviation σ. You do not need to memorize these formulas or where they come from. If you are interested in understanding the transformations that give you this general normal distribution from the unit normal distribution, however, you may wish to read pages 287-288 more closely. Examples: 1. Adult women’s heights are normally distributed, with a mean of 63.5 inches and a standard deviation of 2.5 inches. a. Approximately what percent of women have heights between 61 inches and 68.5 inches? b. Give a range in which approximately 99.7% of all women’s heights should lie. We can use our calculators (under 2ND VARS) to help us with problems that deal with values that aren’t exactly whole numbers of standard deviations away from the mean. Probability density function – normalpdf ( x, m, s) – approximates values in a matching probability histogram Cumulative density function – normalcdf ( x1, x 2, m, s ) – finds the area under the normal distribution between two values (gives the percentage of values that fall in that range) c. Approximately what percent of women are 5 feet, 5 inches tall? d. Approximately what percent of women are between 5 feet and 5 feet, 5 inches? 2. An experiment consists of tossing a coin 10,000 times. a. Write an expression that gives the exact probability of getting exactly 5,000 heads. b. The above expression includes a combination that is too large for our calculators to handle. Therefore, let’s use the normal distribution to approximate the probability of getting exactly 5,000 heads. c. What is the approximate probability of getting between 4,900 and 5,100 heads? d. What is the approximate probability of getting more than 5,100 heads?
