Week 8a Figures ()
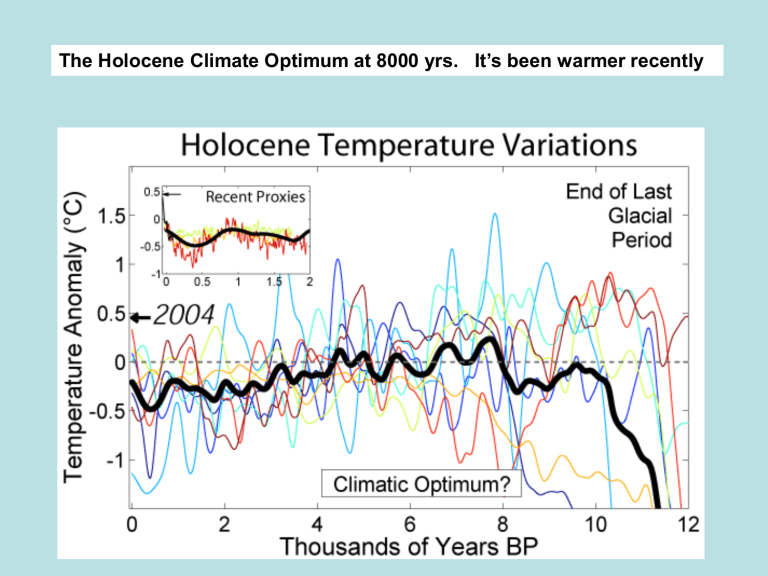
The Holocene Climate Optimum at 8000 yrs. It’s been warmer recently
The Holocene Climate: the place/time where we live. The Last 8000 years.
According to orbital parameters, we should be PAST the present Inter-Glacial
Period and approaching another GLACIAL PERIOD (i.e., reduction in Northern
Hemisphere sunlight, in the summer).
BUT – we don’t seem to be getting colder… The last remnants of the Laurentide
Ice Sheet vanished about 7000 years ago.
The Holocene Climate: the place/time where we live. The Last 8000 years.
Solar Insolation
Solar insolation during the
Holocene was about the same as it was during the Last
Glacial Maximum; and during the previous glacial/interglacial cycles, when the solar insolation changed, the climate changed.
But not now, in the present.
Holocene Features –
1. A mid-Holocene temperature (and CO
2
) rise that started about
8,000 year BP.
2. Atmospheric methane also started to rise, but later - about 5,000 years
BP.
3. We are now here, and large-scale agriculture and anthropogenic deforestation started about
6,000 years BP.
Things to Explain about the Holocene
1. How does the present inter-glacial period (the
Holocene) compare to previous inter-glacial periods?
2.
Why aren’t we heading toward another glacial period?
3. Why did the atmospheric CO
2 mid-Holocene?
and CH
4 start to rise in
4. What caused the recent (2000 BP to 1750 AD) cooling?
5. Is any of this anthropogenically-caused (are humans responsible)?
Carbon Dioxide Cycle
CO
2 cycles: affected by all orbital frequencies, dominated by
100 Ka cycle.
Greater impact on climate than methane changes.
What should CO
2
levels be today?
• Chose a CO
2 value which corresponds to earlyinterglacial CH
4 minima 11,000 years following insulation max. (above, Vostok ice core data)
What should CO
2
be today?
• Taylor Dome CO
2 concentration showing increase at 8 Ka when it should be decreasing.
• Should be 240-245 – is
280-285 ppm
• ~40 ppm excess.
Ice Core Data d
13 C and CO
2 measured in air trapped in ice from Dome C, Antarctica.
During the last 8,000 years,
Antarctic ice cores show an increase in atmospheric
CO
2 of 20 ppmv that is difficult to explain.
Possible explanations of the rise include
1. Decrease in terrestrial storage;
2. Coral reef re-growth;
3. Early Anthropogenic slash and burn agriculture.
Ruddiman “we-warmed-the-Holocene” Hypothesis
Anthropogenic greenhouse gases began to influence climate 6,000 to 8,000 years ago (4 to
6,000 years BC) due to the rise of agriculture.
• Major destruction of forests caused CO
2 to increase in atmosphere – affected climate by
8000 years ago.
• Rice production and irrigation produced enough
CH
4 by 5000 BP to affect climate.
Secondary Ruddiman Hypothesis
Deaths due to pandemic plagues and subsequent abandonment of farms during the last 2,000 years, and resulting re-growth of forests, sequestered CO
2 and cooled climate periodically.
Early anthropogenic hypothesis .
Human activities during the late
Holocene caused increases in
(a) CH
4 and
(b) CO
2
That are recorded in ice cores, and this is in contrast to the downward trends in these GHSs during previous interglaciations (during similar periods with the same orbital parameters).
(c) Late Holocene greenhouse gas increases preventing much of the natural cooling that occurred in previous inter-glaciations.
The closest 65 °N insolation analog within MIS stage 11 indicating that the current (Holocene) interglacial period should have ended by now.
Comparison of trends of (left) methane and (right) CO
2 during the last five interglaciations based on the Vostok gas timescale of Ruddiman and Raymo
[2003] and Ruddiman [2005a].
SUPERIMPOSE ALL THE GLACIAL TERMINATIONS ON TOP OF EACH
OTHER, based on orbital parameter-based time scale.
Only the Holocene shows an increase in gas concentrations.
Looking at comparing the
Holocene to previous interglacials – just the total summer insolation.
Caloric summer half-year insolation trends during the early parts of the last five interglaciations.
The timescales are aligned on the first precession insolation minimum in each interglaciation.
At and near the point of alignment the insolation values most similar to modern levels occur in stage 9.
Warm enough to prevent glacial expansion
The Impact of a Glacial Threshold
The glacial threshold depends on positions of continents, CO
2 circulation rates, etc. levels, ocean
Estimated anthropogenic CH
4 anomaly of 230 ppb in the year 1500 accounted for by contributions from several sources:
• emissions from livestock and human waste (both linearly tied to human population),
• large emissions from biomass burning and irrigation, and
• climate system feedbacks.
Why excess CO
2
?
Deforestation due to Growth in Agriculture
Europe-Middle East : Significant agriculture 7.8 Ka,
Ox-drawn Plows at 6 Ka.
China : Agriculture at 9.4 Ka, Substantial at 6 Ka
India : Agriculture at 8.5 Ka, Substantial at 8 Ka
Horses Domesticated by 6 Ka.
Water Buffalo by 5 Ka
Why Increasing Methane after 5 Ka?
Rice Production
• Wild rice cultivation by
7.5 Ka
• Irrigation of rice near
5.0 Ka.
• China and India had large-scale irrigation projects.
• Inefficient practices, weeds, no fertilizer, large CH
4
/ person.
Population scientists estimate that all river valleys and flat lands were in food production by then, because they can date the construction of terraces on valley walls (which are labor-intensive places for food production).
Growth of Agriculture
Pattern of deforestation in England based on historical-ecological data.
Early phase of largescale land clearance for agriculture (‘‘agricultural deforestation’’) continued until all arable land was in use (soon after 1089 in England).
The later (and final) phase of deforestation of higher, more remote terrain (‘‘resource deforestation’’) was smaller in magnitude.
Per capita deforestation peaked near the end of the phase of agricultural deforestation and then fell substantially (use of coal).
Geographical distribution of griculture by 2000 BP
(0 AD)
What about lack of CO
2 increase during last 2,000 years – seen in ice core data below?
Plagues Reforestation
What about lack of CO
2
increase last
2,000? Plagues Reforestation
• Example: Bubonic Plague 540 to 542 AD
– Est. 50% of population in England died
– 25% in Europe and North Africa died
• Plagues encouraged by Agriculture practices
Bubonic Plague – Rat lice
Smallpox – from Pigs
• Cholera – India, China, Europe
Black Bars, epidemics and population reduction.
Red line; extrapolated CO
2 levels from previous data
Circles: CO
2 levels measured from Antarctic ice cores
Plague-Induced Reforestation Estimates
• Jostinian Plague 164 to 592 AD - ~22% reforestation.
• Black Death 1347 to 1352 – 25 to 45% reforestation.
• Americas – 1550 to 1800 Native American population decimated by 90% (55 million to 5 million) – 5 to 10% of forests re-grew.
Plague versus volcanism and solar forcing; alternative hypotheses
Industrial Era View
Impulse response function (Joos et al. [2004]) showing the effect of carbon system exchanges on the amount of carbon in the atmosphere.
If 10 Gt C were suddenly sequestered in forests, the initially large perturbation
(reduction) in atmospheric CO2 concentrations would decrease rapidly for several decades and then much more slowly over centuries and millennia.
Reservoir Exchange Rates
Gigatons C/yr or Pg C/yr
(a) Model simulation of the effects of major depopulation intervals on atmospheric carbon. Solid black lines are carbon lost from the atmosphere and sequestered in forests, based on historical data.
(b) Solid red line shows the simulated effect of reforestation on atmospheric CO
2 concentration resulting from exchanges with other carbon reservoirs;
(c) dashed red line shows additional reductions caused by reductions in deforestation and coal burning.
Lower Panel: Composite CO2 target signal compiled from the welldated Law and Taylor Dome record.
Net anthropogenic contributions during the
Holocene to
(a) atmospheric CH
4 concentration,
(b) CO
2 and concentration,
(c) global mean temperature.
a decrease in terrestrial carbon storage – fewer trees and vegetation; increases in sea surface temperature – seawater less soluble to CO
2 coral reef regrowth,
Ca 2+ + 2 HCO
3
- → CaCO
3
+ CO
2
+ H
2
O
Ruddiman [2003] proposed that the CO
2 by human activities including CO
2 growth was caused emissions due to slash and burn agriculture. Basically, we did it.
Alternative Hypotheses – not everyone buys the Ruddiman theory.
...”Ice core data of atmospheric CO
2 between 8 ka BP and preindustrial climate can only be reproduced if CO
2 outgassing due to shallow water sedimentation of CaCO
3 considered…. is
We can therefore explain the late Holocene rise in CO
2 invoking natural forcing factors only, and anthropogenic by forcing is not required to understand preindustrial CO
2 dynamics.”
How does this work?
Ca++ + 2HCO
3
-
--> CaCO
3
+ H
2
O +
CO
2
(forams) and
Corals make their skeletons from aragonite; a form of calcite.
If they re-grow vigorously, this formation of calcium carbonate will release CO2 into the atmosphere, which could give the 20 ppm CO2 elevation observed in the mid-Holocene.
Ice Core Data d
13 C and CO
2 measured in air trapped in ice from Dome C, Antarctica.
During the last 8,000 years,
Antarctic ice cores show an increase in atmospheric
CO
2 of 20 ppmv that is difficult to explain.
Possible explanations of the rise include
1. Decrease in terrestrial storage;
2. Coral reef re-growth;
3. Early Anthropogenic slash and burn agriculture.
So now you have a hypothesis with well-respected climate scientists on both sides.
1. Early Human agriculture (and subsequent plagues) caused elevated (by 20 ppm) CO2 levels in the mid-Holocene – which decreased when the population underwent dramatic reductions.
or
2. The mid-Holocene CO
2 increase of 20 ppm was NOT anthropogenically caused, but was (instead) driven by increased calcium carbonate formation in coastal waters.
The jury is still out on this issue.
Climate for the last 1,000 years puts the
Holocene warming in perspective.
Anthropogenic sources have raised CO
2 levels from 280 ppm to 387 ppm in last
150 years. And increased temperatures by 0.76 °C.


