lab1
advertisement
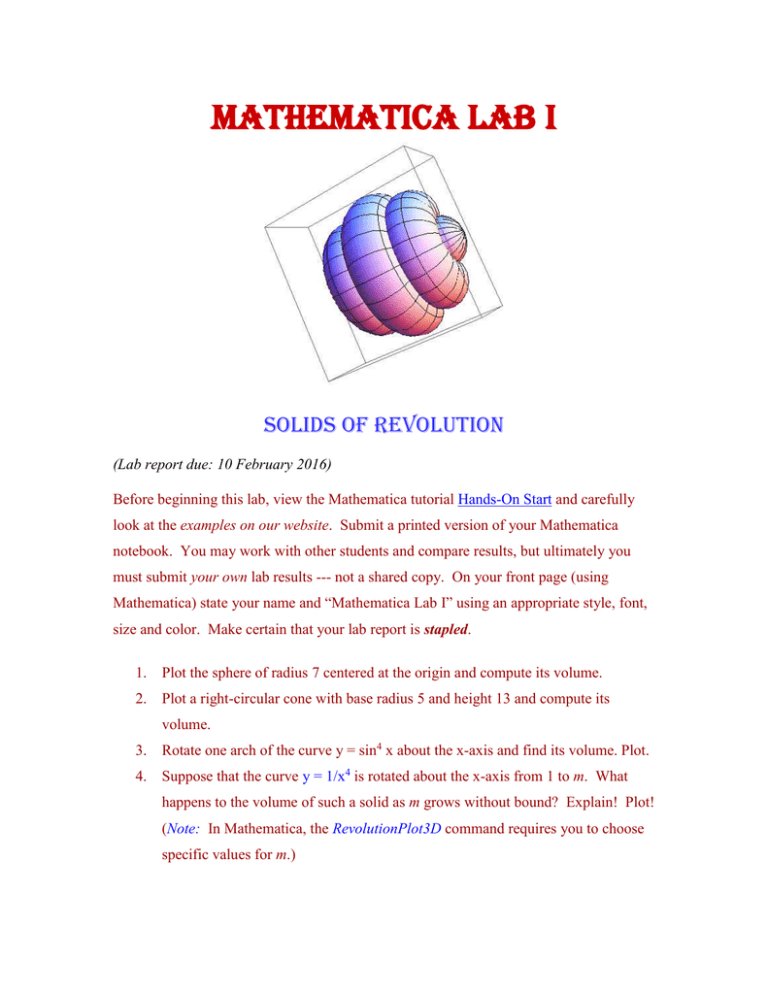
Mathematica Lab I Solids of Revolution (Lab report due: 10 February 2016) Before beginning this lab, view the Mathematica tutorial Hands-On Start and carefully look at the examples on our website. Submit a printed version of your Mathematica notebook. You may work with other students and compare results, but ultimately you must submit your own lab results --- not a shared copy. On your front page (using Mathematica) state your name and “Mathematica Lab I” using an appropriate style, font, size and color. Make certain that your lab report is stapled. 1. Plot the sphere of radius 7 centered at the origin and compute its volume. 2. Plot a right-circular cone with base radius 5 and height 13 and compute its volume. 3. Rotate one arch of the curve y = sin4 x about the x-axis and find its volume. Plot. 4. Suppose that the curve y = 1/x4 is rotated about the x-axis from 1 to m. What happens to the volume of such a solid as m grows without bound? Explain! Plot! (Note: In Mathematica, the RevolutionPlot3D command requires you to choose specific values for m.) 5. Consider the region R bounded above by one arch of the cycloid: x(t) = 3(t – sin t), y(t) = 3(1 – cos t), 0 ≤ t ≤ 2, and below by the x-axis. Find the volume of the solid of revolution obtained by rotating R about the y-axis. (Express your answer to the nearest tenth.) Plot! 6. A lab glass container can be modeled by revolving the graph of 0.1x 3 2.2 x 2 10.9 x 22.2 if 0 x 11.5 f ( x) 2.95 if 11.5 x 15 about the x-axis, where x and y are measured in centimeters. Plot the solid and compute its volume (to the nearest tenth). (Note: You will need to use the Piecewise command to define f(x).) "I could have done it in a much more complicated way," said the red Queen, immensely proud. - Lewis Carroll Course Home Page Department Home Page Loyola Home Page
![1S3 Mathematica Exercises [To be done during computer tutorials]](http://s2.studylib.net/store/data/010571865_1-da570e7b8d815f58cf7a408a6d0c1fa1-300x300.png)
