(Mathematics) DEGREE EXAMINATION, MAY 2009
advertisement
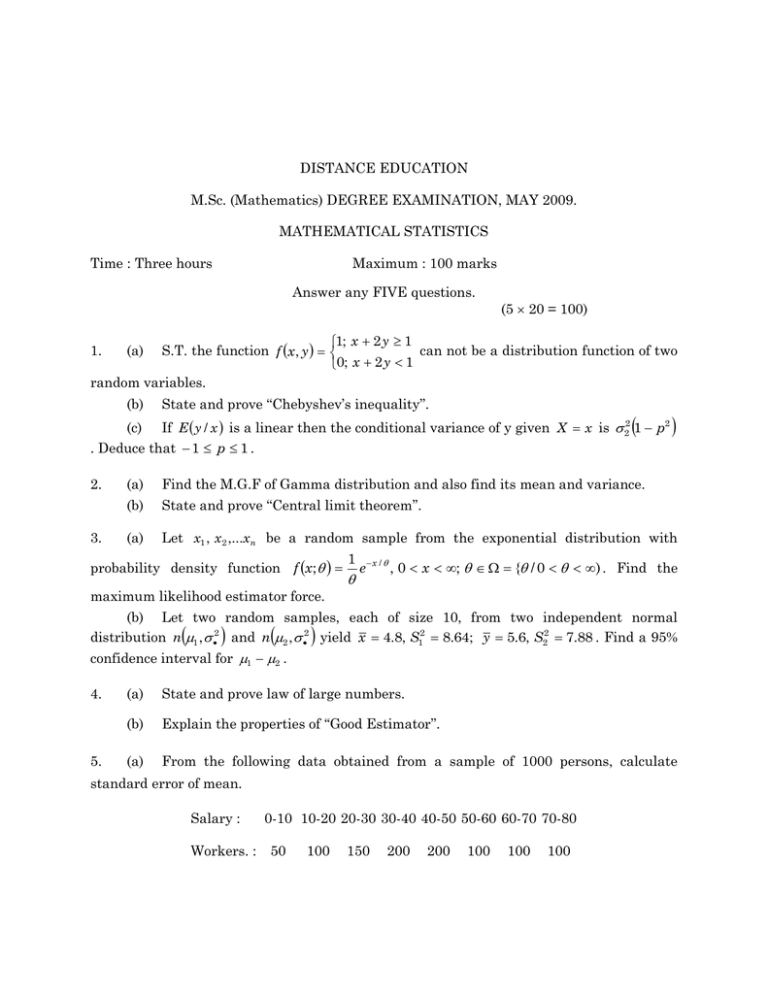
DISTANCE EDUCATION
M.Sc. (Mathematics) DEGREE EXAMINATION, MAY 2009.
MATHEMATICAL STATISTICS
Time : Three hours
Maximum : 100 marks
Answer any FIVE questions.
(5 20 = 100)
1.
(a)
1; x 2 y 1
S.T. the function f x , y
can not be a distribution function of two
0; x 2 y 1
random variables.
(b)
State and prove ‘‘Chebyshev’s inequality’’.
(c) If E y / x is a linear then the conditional variance of y given X x is 22 1 p2
. Deduce that 1 p 1 .
2.
3.
(a)
Find the M.G.F of Gamma distribution and also find its mean and variance.
(b)
State and prove ‘‘Central limit theorem’’.
(a)
Let x1 , x 2 ,...x n be a random sample from the exponential distribution with
probability density function f x;
1
e x / , 0 x ; { / 0 ) . Find the
maximum likelihood estimator force.
(b) Let two random samples, each of size 10, from two independent normal
distribution n 1 , 2 and n 2 , 2 yield x 4.8, S12 8.64; y 5.6, S22 7.88 . Find a 95%
confidence interval for 1 2 .
4.
5.
(a)
State and prove law of large numbers.
(b)
Explain the properties of ‘‘Good Estimator’’.
(a)
From the following data obtained from a sample of 1000 persons, calculate
standard error of mean.
Salary :
Workers. :
0-10 10-20 20-30 30-40 40-50 50-60 60-70 70-80
50
100
150
200
200
100
100
100
Is it likely that the sample has come from the population with an average weekly
earnings of Rs. 4,200.
6.
(b)
State and prove ‘‘Neyman-Pearson theorem’’.
(a)
Find the critical region of the Likelihood ratio test for testing the null hypothesis
H 0 : 0 against the composite alternative H1 : 0 on the basis of a random sample
size n from a normal population with the known variance 2 .
(b)
Intelligence test on two groups of boys and girls gave the following results.
Mean S.B. Sample size
Girls :
75 15
150
Boys :
70 20
250
Is there a significant difference in the mean scores obtained by boys and girls?
7.
(a)
Discuss the 3 types of acceptance sampling plans.
(b)
For the sampling Plan N = 1200, n = 64, c = 1.
Determine the probability of acceptance of the following lots;
(i)
0.5% defective
(ii)
0.8% defective
(iii) 1% defective
(iv)
2% defective
(v)
4% defective
(vi)
10% defective.
Also draw an OC curve.
8.
(a)
What is classification? Explain the types of classification?
(b) 3 varieties of coal were analysed by 5 chemists and the ash content in the
varieties was found to be as under :
Chemist
Variety
I
II
III
IV
V
A
9
7
6
5
8
B
7
4
5
4
5
C
6
5
6
7
6
Do the varieties differ significance in their ash content?
———————
