MS PowerPoint - National Schools' Observatory
advertisement
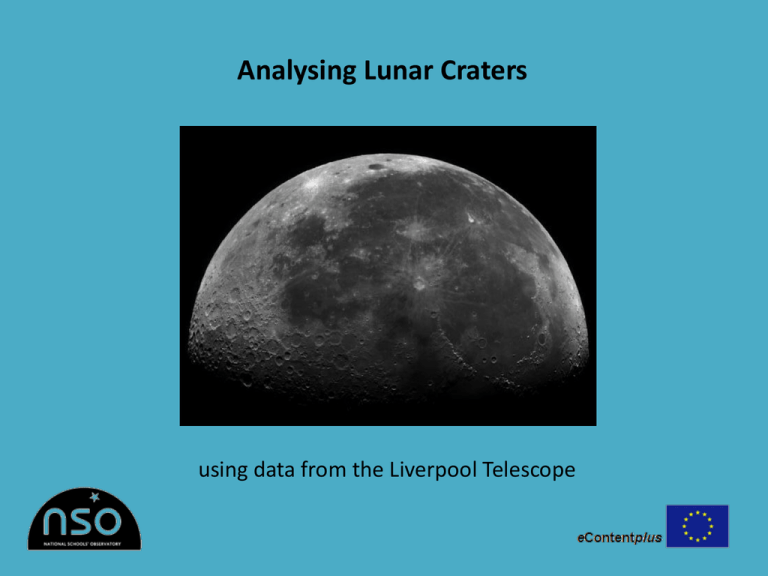
Analysing Lunar Craters using data from the Liverpool Telescope The Project The following project gets students to look in detail at images of the Moon to determine whether the density, size and appearance of craters varies across the lunar surface. The Project - Discussion Whilst there are more accurate ways of measuring the size, density and brightness of objects on the Moon’s surface, such as radar mapping by an orbiting spacecraft, the methods used here will result in a basic analysis of the problem, but using tools available in the typical classroom. Background The Moon is our nearest neighbour in space, and the only celestial body on which we can see surface detail without the need for a telescope. Look more closely, however, and it is soon apparent that the lunar surface is not smooth, but hosts a variety of dark and bright regions, mountain ranges and thousands upon thousands of craters. In this exercise we will examine image data of the Moon taken by the Liverpool Telescope, and use it to try and quantify those surface changes. Moon Phases When the phase of the Moon is full, the Sun is right behind us and sunlight falls straight down onto the lunar surface. As a result, it can be hard to determine the exact nature of crater features – especially in bright regions. However, when the Moon is close to first quarter or last quarter phase, it is often easier to spot the extent of craters, due to the shadows that are cast. In a sense, shadows can make the surface of an object appear more 3 dimensional. Prediction If one were to examine an image of a small planet, such as Mercury (see right), one might expect that the surface of similar rocky objects would have a roughly even spread of craters. After all, the asteroids that created the larger craters we see would have been fairly evenly spread throughout the early Solar System, when the majority of impacts took place, and with such and even distribution of ‘crater makers’, one might predict an even (or uniform) distribution of craters. The planet Mercury ©NASA The Task – Surface Analysis Out task is to select two or three regions of the Moon which members of the class can investigate. By taking a few measurements and recording what we see, we can start to quantify the differences between the chosen areas. Assembling the Moonsaic Now that we know the task, we need to assemble a large mosaic of the accompanying 20 Moon images so that we can select a few regions of the lunar surface to explore. The image data has been converted to JPEG format so that you can print them out and stick them together – like a jigsaw puzzle. Note that each image overlaps slightly, which will help to match the edges and glue them securely. Moonsaic Use the included moonmap.jpg file to determine where each section of the moonsaic JPEGs should go. Have fun ! Making your Measurements Once the moonsaic is complete, select two or three regions (or image panels) to investigate and assign them to different members of the class. The first measurement we can make is to count the number of craters above a certain size in the section. Don’t choose a size that is too small or you may be there all day, but make sure you all agree on the same minimum width. Moon Region Number of Craters Size of Largest Crater (cm) Section 1 Section 2 Section 3 Make sure you number each of the craters on the moonsaic, and ensure that everyone is using the same units when measuring. Calibrating the Result We now need to calibrate our results, so that we can express crater widths in units that we can better understand, such as kilometres. To do this we need to measure the radius of the Moon with a ruler, find out what the actual radius is and then apply some simple algebra. There are various methods for calculating the lunar radius, which you can discuss now, but for the purposes of this exercise we shall tell you that: Radius of Moon = 1738 km Now for the algebra: CraterWidt h(km) CraterWidt h(my units ) MoonRadius (km) MoonRadius (my units ) Describing the Region The next step is to look at the region you have been given and describe it. Is it entirely covered in craters or are there any flat regions. Try to generate a percentage estimate of how much of the region (i.e. the area) is cratered. Are there any mountain ranges visible and if so, how far do they stretch. Are there any unusual features to be seen? When you are agreed on a description, write it down on a piece of paper so that you can recall it later. Discussion Our initial prediction suggested that the lunar surface may have an even covering of asteroid impacts or craters – how does that prediction fit with your results? Of course, the method we have used will only give us a rough estimate for a limited selection of the Moon’s surface. Can you think of any areas of the process where errors may have crept into your measurements? Can you think of other ways in which we could identify the differences between different regions of the Moon? Questions, Exercises & Tasks Now that you have measured the number of large craters in each section, you may want to record the size of all the craters you labelled, to see if the average size changes from region to region. Would you expect a difference? You may also want to explore the process of how mountains are created in the centre of craters following an impact. Look at the Moonsaic again, and then try to work out whether it was taken at first or last quarter phase. Try to establish in which direction the Moon orbits the Earth.
