Linear Functions - Miami Beach Senior High School
advertisement
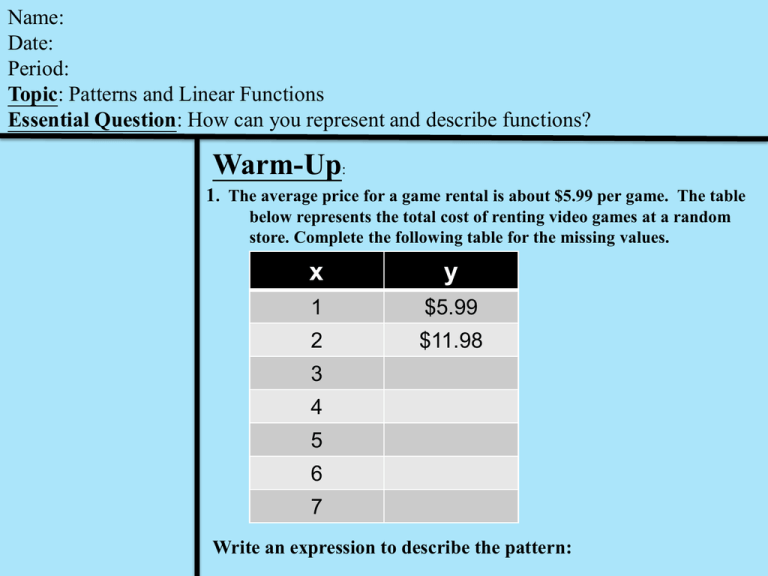
Name: Date: Period: Topic: Patterns and Linear Functions Essential Question: How can you represent and describe functions? Warm-Up: 1. The average price for a game rental is about $5.99 per game. The table below represents the total cost of renting video games at a random store. Complete the following table for the missing values. x y 1 $5.99 2 $11.98 3 4 5 6 7 Write an expression to describe the pattern: Complete the table below, identify the pattern, and write the appropriate expression. Identify quantities in the pictures that vary in response to other quantities: Vocabulary: Independent Variable • Inputs (Domain) Dependent Variable • Outputs (Range) is a variable that provides the input values of a function • the values of ‘x’ or independent variable is a variable that provides the output values of a function • the values of ‘y’ or dependent variable is a relation that assigns exactly one value in the range to each value of the domain. (No Value in the DOMAIN can be repeated) Functions x y x y 1 2 1 2 2 4 2 4 3 6 2 6 4 8 4 8 (3, 4), (5, 6), (7, 8) (3, 4), (3, 6), (7, 8) Yes Not Vocabulary: Linear Functions a function whose graph is a nonvertical line. These are functions, but Non-linear functions y Quick Graphing Review (Plotting Values) Page 243 (1) x Work with a partner. Copy and complete each table for the sequence of similar rectangle. Graph the data in each table. Decide whether each pattern is linear or nonlinear. Independent Practice: Page 243 Lesson Check (3 and 5) 34. 35. EOC Practice Wrap-Up: Vocabulary Review Quarter 2-HLA#1: Hand-Out

