Jurnal
Teknologi
Full Paper
EXPERIMENTAL STUDY OF A TANKER SHIP SQUAT IN
SHALLOW WATER
Article history
Received
2 July2014
Received in revised form
5 November 2014
Accepted
25 November 2014
Mohd Apung Saja, Mohammad Saeed Seifa*
Institut Maritim Jawa Tengah, Pekalongan, Indonesia
Center of Excellence in Hydrodynamics & Dynamics of Marine
Vehicles, Sharif University of Technology, Tehran, Iran
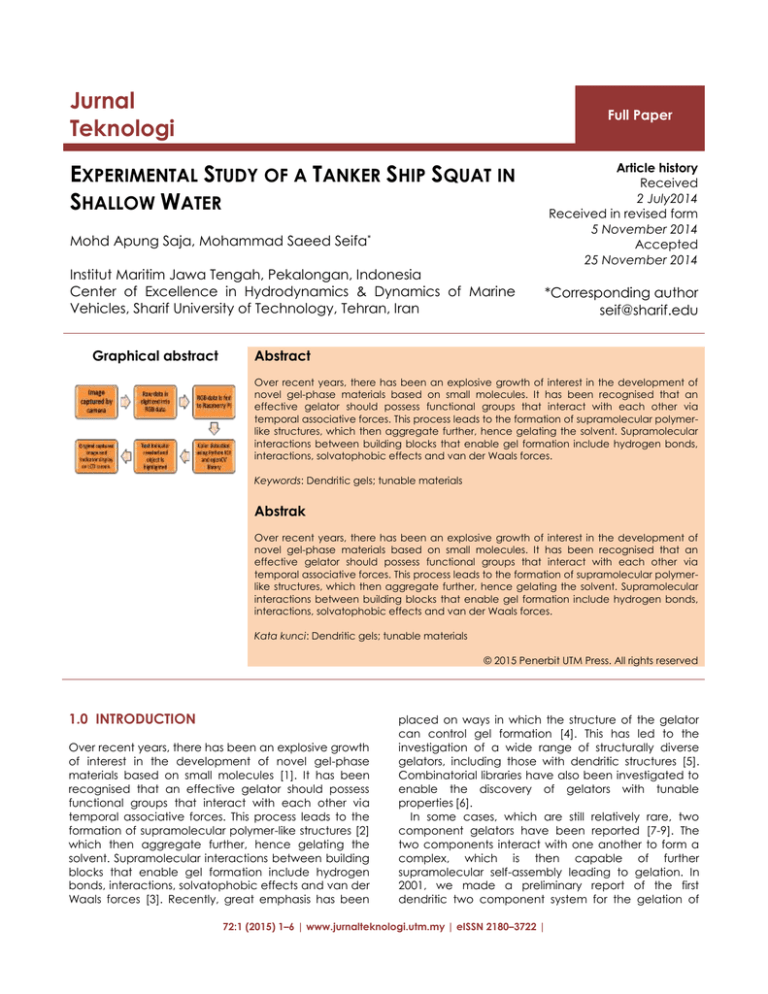
Graphical abstract
*Corresponding author
seif@sharif.edu
Abstract
Over recent years, there has been an explosive growth of interest in the development of
novel gel-phase materials based on small molecules. It has been recognised that an
effective gelator should possess functional groups that interact with each other via
temporal associative forces. This process leads to the formation of supramolecular polymerlike structures, which then aggregate further, hence gelating the solvent. Supramolecular
interactions between building blocks that enable gel formation include hydrogen bonds,
interactions, solvatophobic effects and van der Waals forces.
Keywords: Dendritic gels; tunable materials
Abstrak
Over recent years, there has been an explosive growth of interest in the development of
novel gel-phase materials based on small molecules. It has been recognised that an
effective gelator should possess functional groups that interact with each other via
temporal associative forces. This process leads to the formation of supramolecular polymerlike structures, which then aggregate further, hence gelating the solvent. Supramolecular
interactions between building blocks that enable gel formation include hydrogen bonds,
interactions, solvatophobic effects and van der Waals forces.
Kata kunci: Dendritic gels; tunable materials
© 2015 Penerbit UTM Press. All rights reserved
1.0 INTRODUCTION
Over recent years, there has been an explosive growth
of interest in the development of novel gel-phase
materials based on small molecules [1]. It has been
recognised that an effective gelator should possess
functional groups that interact with each other via
temporal associative forces. This process leads to the
formation of supramolecular polymer-like structures [2]
which then aggregate further, hence gelating the
solvent. Supramolecular interactions between building
blocks that enable gel formation include hydrogen
bonds, interactions, solvatophobic effects and van der
Waals forces [3]. Recently, great emphasis has been
placed on ways in which the structure of the gelator
can control gel formation [4]. This has led to the
investigation of a wide range of structurally diverse
gelators, including those with dendritic structures [5].
Combinatorial libraries have also been investigated to
enable the discovery of gelators with tunable
properties [6].
In some cases, which are still relatively rare, two
component gelators have been reported [7-9]. The
two components interact with one another to form a
complex, which is then capable of further
supramolecular self-assembly leading to gelation. In
2001, we made a preliminary report of the first
dendritic two component system for the gelation of
72:1 (2015) 1–6 | www.jurnalteknologi.utm.my | eISSN 2180–3722 |
2
Mohd Apung Saja & Mohammad Saeed Seifa / Jurnal Teknologi (Sciences & Engineering) 72:1 (2015) 1–6
organic solvents [10]. This two component system has
a number of features which are important for effective
gel formation: a) acid-base interactions between
components, b) dendritic branching, c) aliphatic
diamine spacer chain. This communication illustrates
how using two components enhances the tunability of
gel-phase materials, and indicates three ways in which
macroscopic properties and microstructural features
of the gel can be controlled.
As might be expected, the concentration of the
gelator system controls the structure and properties of
the gel. The solvated gelator network was observed
using cryo transmission electron microscopy (cryo TEM)
at different concentrations, maintaining a 2:1
(dendrimer:diamine) ratio. At low concentration, thin
fibres were present, which at higher concentration
aggregate and assemble into thick fibre bundles. The
effect of molar concentration on the thermally
reversible gel-sol phase transition (Tgel) was monitored
using the tube inversion technique [11]. The validity of
this approach, and the reversibility of the phase
transition, was checked with differential scanning
calorimetry. As the molar concentration of the dual
components as shown in Table 1.
Table 1 Catalytic alkylation of resorcinol to 4-tert-butyl resorcinol and 4,6-di tert-butyl resorcinol a
Entry
Catalysts
Conversion
/%
Product yield /
mmol
Selectivity / %
4-tert butyl
resorcinol
1
MA
2
Ratio of Lewis acid to
Brönsted acid b
4,6-di tertbutyl
resorcinol
0
0
0
0
0
3%Ga-BEA
38.0
15.6
97.4
2.6
0.5
3
8%Ga-BEA
54.4
21.7
95.8
4.2
0.7
4
10%Ga-BEA
59.1
23.6
100
0
1.0
5
25%Ga-BEA
32.2
12.9
100
0
1.5
6
H2SO4 c
6.5
2.6
96.0
4.0
7
MA + H2SO4d
6.0
2.4
96.0
4.0
contain only Brönsted
acid
1.0
aAll
reactions were carried out at 80 °C for 8 h with resorcinol (40 mmol), MTBE (60 mmol) and catalyst (0.2 g) with vigorous stirring.
ratio of Lewis acid to Brönsted acid is calculated by using the peak area of peaks at wavenumber of 1540 cm -1 and 1450 cm-1 for Brönsted and
Lewis acids, respectively (see Figure 1).
cThe amount of H SO is 25 mol.
2
4
dThe MA in a solution containing H SO . The amount of MA and H SO are similar as entries 1 and 6, respectively.
2
4
2
4
bThe
2.0 EXPERIMENTAL
In a two-component gel, it is easy to modify the
molecular structure of either of the two components.
supplied to the board by connecting a micro USB to
USB cable to a wall socket USB adapter or power
bank.
3.2 Object Highlighting
3.0 RESULTS AND DISCUSSION
3.1 Full Hardware Setup
The whole system is setup by connecting the PI
camera module to the CSI port on the Raspberry PI
board via ribbon cable while the LCD screen is
connected to the board via HDMI cable. The wireless
keyboard and mouse is connected to the board
using wireless USB adapter. This is only needed when
manipulation of code is required. The power is
The second part of the application is highlighting the
regions, which have the same HSV value as the
centre of the circle. In coding aspect, two thresholds
are used for the filtering process. The low threshold is
an array which contains the minimum of the HSV
value whereas the high threshold holds the maxima
of HSV value. Figure 1 shows the color benchmark,
which consists of 10 different colours such as black,
yellow, orange, green, purple, pink, cyan, blue, grey
and red. It also have different shapes according to
the color and have different sizes of sphere for red
3
Mohd Apung Saja & Mohammad Saeed Seifa / Jurnal Teknologi (Sciences & Engineering) 72:1 (2015) 1–6
color. The prototype color detection assistive device,
for experimental purposes only detects 4 base
colours and HSV within its range. Besides the HSV
range, the result will display unknown or not
detected.
meter. The accuracy of the 4 base colors detection is
about 80%.
Acknowledgement
We are grateful for the UTM scholarship to Author 1.
References
[1]
[2]
[3]
[4]
[5]
[6]
Figure 1 Block diagram of the processes of the system
4.0 CONCLUSION
The nature of the aggregates present in dilute
solution, below the gelation threshold concentration,
was investigated using atomic force microscopy
(AFM). When the two components were present in a
2:1 (dendrimer:diamine) ratio, rod like aggregates
were observed in the AFM The length of these rods
was approximately 100 nm, and their diameters were
ca. 9 nm (depth ca. 1 nm).
The characteristics and type of color blind has
been studied and identified as well as the problem
faced by individual that is color blind. A real-time
color recognizing system using image processing
technique is successfully developed and tested.
A various experiments were performed to test the
functionality of the developed application for color
deviation and range tests. For the color deviation
test, the results showed the deviation on the HSV
value of the tested color was small and within an
acceptable ranges. The results of the range test
showed that the device could recognize color from a
range of 20 cm up to 12 m.
In conclusion, this prototype is able to recognize up
to four colours such as red, blue, green and yellow as
well as their respective variations such as light blue or
dark blue. The region with similar HSV value to the
designated region is also highlighted. The visual
results which is text indicating the object color as well
as the boundary line is successfully shown on the LCD
monitor. The result of the distance test shows that the
hue (H) element is almost consistent whereas the
saturation (S) varies by roughly 49.3% and value (V)
by 30.5%. As for the range of detection, the minimum
range is 12 cm where the maximum range is up to 15
[7]
[8]
[9]
[10]
[11]
[12]
[13]
[14]
[15]
[16]
[17]
[18]
[19]
[20]
[21]
[22]
[23]
[24]
[25]
MeIntyre, D. 2002. Color Blindness. Dalton Publishing.
Christine R. 1999. The Eye of the Beholder–Designing for
Colour-blind Users. British Telecommunications Engineering.
17: 291–295.
Neitz, M. and Neitz, J. 2000. Molecular Genetics of Color
Vision and Color Vision Defects. Archieves of
Ophthalmology. 63(2): 232–237.
Healy, G., Shafer, S. and Wolff, L. 1992. Physics Based Vision:
Principles and Practice, COLOR. Boston: Jones and Bartlett.
Brettel, H. and Vienot, F. 2001. Color Display for Dichromats,
Proceeding of SPIE on Color Imaging. 4300:199–207.
Poret, S., Jony, R. D. and Gregory, S. 2009. Image
Processing for Color Blindness Correction. IEEE Toronto
International Conference. 1–6.
Ohkubo, T. and Kobayashi, K. 2008. A Color Compensation
Vision System for Color-blind People. SICE Annual
Conference. The University ElectroCommunications Japan.
Plataniotis, K. N. and Vinetsanopoulos. A. N. 2000. Color
Image Processing and Application. Berlin: Springer-Verlag.
McDowell, Jason. 2008. Design of a Color Sensing System to
Aid the Color Blind. 27: 34–39.
SeuttgiYmg and Yong Man Ro. 2003. Visual Contents
Adaptation for Color Vision Deficiency. 1: 453–456.
Yau-Hwang Kuo and Jang-Pong Hsu. 1996. MCFC-R: A
Fuzzy Connectionist Model for Color-blindness Plate
Recognition. 2: 718–723.
Swain, M. and Ballard, D. 1991. Color Indexing.
International Journal of Computer Vision. 7: 11–32.
Birch J. 2012. Worldwide Prevalence of Red-green Color
Deficiency. J Opt Soc Am A Opt Image Sci Vis. 29(3): 313–
320.
Konstantakopoulou, E., Rodriguez-Carmona M., and Barbur
J. L. 2012. Processing of Color Signals in Female Carriers of
Color Vision Deficiency. Journal of Vision. 12(2): 1–11.
Hood S. M., Mollon J. D., Purves L. and Jordan G. 2006.
Color Discrimination in Carriers of Color Deficiency. Vision
Research. 46: 2894–2900.
Nathans, J., Thomas, D., and Hogness, D.S. 1986. Molecular
Genetics of Human Color Vision: The Genes Encoding Blue,
Green, and Red Pigments. Science. 232(4747): 193–202.
Sharpe, L. T., Stockman, A., Jagle, H. and Nathans, J. 1999.
Opsin Genes, Cone Pigments, Color Vision and Color
Blindness. In: Gegenfurtner K. R., Sharpe, L. T. (eds). Color
Vision. Cambridge University Press: Cambridge.
Walraven, J. and Alferdinck, J. W. 1997. Color Displays for
the Color Blind. Proc. On Color Science, Systems, and
Application of 5th Color Image Conference, Scottsdale,
Arizona: Society for Imaging Science and Technology. 17–
22.
Bimber, Oliver, and Ramesh, Raskar. 2005. Spatial
Augmented Reality. Massachusetts: A K Peters.
Products for the Blind and Visually Impaired: Colorino
retrieved
November,
20,
201
from
http://www.caretec.at/ColorTest_Colorino.32.0.html/.
Brettel, H., Vienot, F. and Mollon, J. 1997. Computerized
Simulation of Color Appearance of Dichromats. Journal of
Optical Society of America. 14(10): 2647–2655.
Solem, J. E. 2012. Programming Computer Vision with
Python. Sebastopol: O’Reilly Media.
Joseph Howse. 2013. OpenCV Computer Vision with
Python. Birmingham: Packt Publishing Ltd.
Bradsky, G. and Kaehler, A. 2008. Learning OpenCV.
California: O’Reilly Media.
Jeffries, B. J. 1880. Color-blindness: Its Dangers and Its
Detection. Boston: Houghton, Osgood and Company.
4
Mohd Apung Saja & Mohammad Saeed Seifa / Jurnal Teknologi (Sciences & Engineering) 72:1 (2015) 1–6

