mec12131-sup-0001-TableS1-S2-FigS1-S2
advertisement
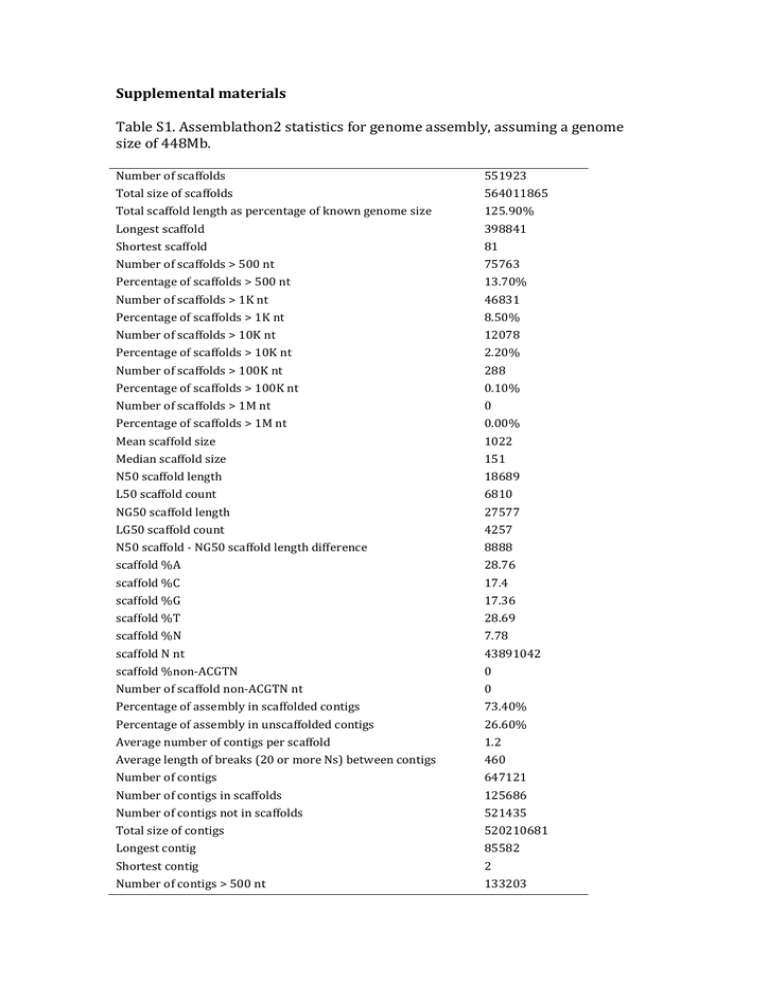
Supplemental materials Table S1. Assemblathon2 statistics for genome assembly, assuming a genome size of 448Mb. Number of scaffolds 551923 Total size of scaffolds 564011865 Total scaffold length as percentage of known genome size 125.90% Longest scaffold 398841 Shortest scaffold 81 Number of scaffolds > 500 nt 75763 Percentage of scaffolds > 500 nt 13.70% Number of scaffolds > 1K nt 46831 Percentage of scaffolds > 1K nt 8.50% Number of scaffolds > 10K nt 12078 Percentage of scaffolds > 10K nt 2.20% Number of scaffolds > 100K nt 288 Percentage of scaffolds > 100K nt 0.10% Number of scaffolds > 1M nt 0 Percentage of scaffolds > 1M nt 0.00% Mean scaffold size 1022 Median scaffold size 151 N50 scaffold length 18689 L50 scaffold count 6810 NG50 scaffold length 27577 LG50 scaffold count 4257 N50 scaffold - NG50 scaffold length difference 8888 scaffold %A 28.76 scaffold %C 17.4 scaffold %G 17.36 scaffold %T 28.69 scaffold %N 7.78 scaffold N nt 43891042 scaffold %non-ACGTN 0 Number of scaffold non-ACGTN nt 0 Percentage of assembly in scaffolded contigs 73.40% Percentage of assembly in unscaffolded contigs 26.60% Average number of contigs per scaffold 1.2 Average length of breaks (20 or more Ns) between contigs 460 Number of contigs 647121 Number of contigs in scaffolds 125686 Number of contigs not in scaffolds 521435 Total size of contigs 520210681 Longest contig 85582 Shortest contig 2 Number of contigs > 500 nt 133203 Percentage of contigs > 500 nt 20.60% Number of contigs > 1K nt 84301 Percentage of contigs > 1K nt 13.00% Number of contigs > 10K nt 9510 Percentage of contigs > 10K nt 1.50% Number of contigs > 100K nt 0 Percentage of contigs > 100K nt 0.00% Number of contigs > 1M nt 0 Percentage of contigs > 1M nt 0.00% Mean contig size 804 Median contig size 167 N50 contig length 5078 L50 contig count 22857 NG50 contig length 6730 LG50 contig count 16683 N50 contig - NG50 contig length difference 1652 contig %A 31.18 contig %C 18.87 contig %G 18.82 contig %T 31.11 contig %N 0.02 contig N nt 89858 contig %non-ACGTN 0 Number of contig non-ACGTN nt 0 Explanatory notes on statistics from http://assemblathon.org/: Each scaffold is split on runs of 25 or more ‘N’ characters to form ‘contigs’. Any contigs that could be split in this way are regarded as ‘scaffolded contigs’. Scaffolds that don’t have runs of 25 or more ‘N’ characters are also counted as ‘unscaffolded contigs’. N50 scaffold/contig length is calculated by summing lengths of scaffolds/contigs from the longest to the shortest and determining at what point you reach 50% of the total assembly size. The length of the scaffold/contig at that point is the N50 length. The L50 measure is the number of scaffolds/contigs that are greater than, or equal to, the N50 length. The NG50 and LG50 measures are the same as the N50 and L50 measures except that rather than compare against the total assembly size, we compare against the estimated genome sizes of the three species. 425 574 582 583 605 1045 1123 1124 1153 1158 1183 1184 1578 97 325 97 Table S2. Sequenced RAD loci shared between each pair of samples, expressed as a percentage of the total number of loci in the RAD locus catalog from the sample listed in the left-hand edge column. 44 43 45 53 45 41 39 45 41 36 40 42 41 42 50 47 40 51 46 43 51 46 39 44 48 47 47 51 42 54 49 46 54 49 42 47 51 50 50 48 56 52 49 56 51 45 51 53 54 53 46 41 39 43 41 37 40 42 42 42 37 33 41 36 30 35 38 37 37 50 56 52 46 51 54 54 54 59 56 51 56 58 58 58 45 37 43 46 46 46 46 51 53 53 53 58 60 59 60 55 55 55 52 52 325 42 425 45 53 574 50 55 55 582 56 44 43 45 583 34 40 39 37 33 605 48 56 55 54 45 57 1045 52 59 59 58 50 60 57 1123 42 49 48 46 38 50 44 41 1124 48 56 55 53 46 56 52 49 57 1153 54 60 61 61 52 61 59 57 61 59 1158 49 57 56 56 47 58 54 51 57 54 48 1183 47 54 54 52 44 55 51 48 55 50 44 49 1184 47 55 55 54 45 56 52 49 56 51 45 51 54 1578 47 54 54 52 44 55 51 48 55 50 44 49 53 53 52 Figure S1. Photograph of Betula nana individual 097-10 used for genome sequencing Figure S2. Flow chart outlining analysis pipelines used in this study
