Aggregate Demand & Supply: Economics Presentation
advertisement
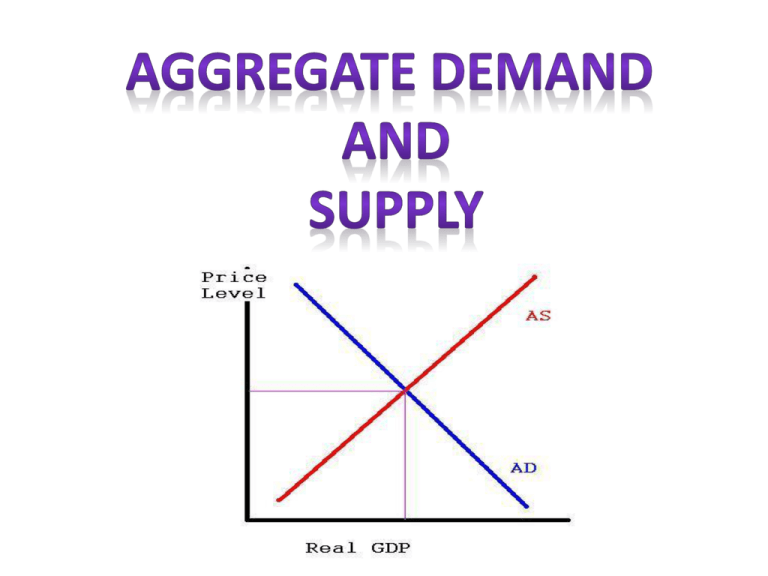
Aggregate Demand (AD): Is the relationship between the general price level and total spending in the economy. Aggregate demand can be expressed in two ways: - Aggregate Demand Schedule - Aggregate Demand Curve Increase in Aggregate Demand: An increase in total expenditures at all price levels Decrease Aggregate Demand: decrease in total expenditures at all price levels. Wealth effect: With changes in the price level, the real value of the households’ financial assets changes, causing households to adjust spending. Foreign Trade Effect: changes in price level means expenditures on imports change in the same direction while expenditures on exports change in the opposite direction. Consumer spending is decided when households determine how much to spend or save. Changes in consumer spending also change expenditure which, causes a shift in the aggregate demand curve. Disposable income (DI): Most significant determinant of consumer spending. Total DI may change as result of population change in changes in DI per household. Direct relationship between DI and consumer spending so when DI rises the consumer spending rises. Wealth: Made up of financial an real assets. Real assets (houses and appliances) financial assets (stocks and bonds). •Example: Stock increase/decrease Consumer Expectation: Influence the demand for a single product. (example War/ flood…..spend more save less) Interest Rates: Households often borrow to purchase durable goods. If interest rate falls consumers more likely to borrow (increase in AD). If jump in interest rate the opposites happens and spending falls (decrease in AD) Investment represents spending on projects where earning a profit is anticipated. The investment component of AD is limited to planned investment. - Interest Rates: rise = fall in AD fall= increase in AD - Business Expectation: profit increase/decrease Rise in Government purchases (i.e highway construction ) increase AD and a fall causes a decrease in AD. Net exports can vary due to changes in the price level. Foreign Incomes: The Rising of falling of income on foreign countries will impact the exports of Canadian good to other countries increasing or decreasing the AD. ( i.e Rise of income in France) Exchange rates: the change in exchange rates effects the net exports. If the Can. dollar goes up the net exports fall or vice versa. Graph the Following: Aggregate Demand Schedule for 2002 Real GDP Price Level Aggregate demand $Billions (real GDP) 200 650 160 700 120 750 Aggregate Demand Shift the Aggregate Demand Curve based on a $50 Billion increase Identify the impact of each of the following trends on the aggregate supply. In each case where there is a shift, explain which component(s) of aggregate demand cause the shift: a.The federal government cuts taxes for low-income households. b.There is a slump in share prices on Canadian stock markets. c.The price level in Canada rises. d.Canadian interest rates fall e.The Canadian dollar rises in value against the U.S. Aggregate Supply (AS): The relationship between the general price level and real output produced in the economy Or The total supply of all goods and services produced in a society. Aggregate demand can be expressed in two ways: - Aggregate Supply Schedule - Aggregate Supply Curve The Aggregate supply curve displays the total amount of good and services that would be supplied at each price level. As measured by the Chain Fisher volume index, in an economy The AS curve features some important differences from the supply curve you are familiar with in microeconomics… -The very elastic portion that occurs at the low output levels. - At very low output most of society’s resources are sitting idle. amounts of - As more output is produced, more competition occurs among producers for limited land, labour and capital inputs. - At higher output levels, the prices tend to rise much more rapidly. Aggregate Supply Factors: variables that change total output at all price levels. Input Prices: Aggregate Supply assumes steady input prices for the businesses that are producing the output. When a rise in the price of an input pushes up the production cost, businesses reduce their real output and aggregate supply curve shifts to the left. Also works in the other direction with pushing cost down. Resource Supplies: Over the long tern, supplies of resources in an economyespecially human and capital resources – tend to grow. With any such increase businesses produce more real output at every price level. More inputs over the long run increase aggregate supply. Productivity: Is the real output produced per unit of output over a given period of time. Labour Productivity is the quantity of output produced per worker in a certain period of time. A technological increases the real output. Likewise a technological decline reduces the real output. Government policies: Can influence AS through their effects on the business environment in an economy. Example: taxes rise for businesses and households, because after-tax returns on supplying economic resources are pushed down businesses and households may reduce the resources they supply causing a fall in real outputs. Graph the Following: Aggregate Supply Schedule for 2002 Real GDP Price Level Aggregated Supply Aggregate Supply $billions (real GDP) 120 650 160 700 200 725 240 730 Shift the aggregate supply curve based on a $50 billion increase. Identify the impact of each of the following trends on the aggregate supply. In each case , specify whether the change in aggregate supply is a short run or a long run change: a. The federal government introduces tough new environmental regulations on Canadian business. b.The price of electricity increases. c. wages for Canadian workers are reduced d.Global warming causes a rise in ocean levels, effecting Canadian costal areas e.Due to decline in immigration, the size of the Canadian Labour force declines.


