Unit 2 Inferences Assessment
advertisement
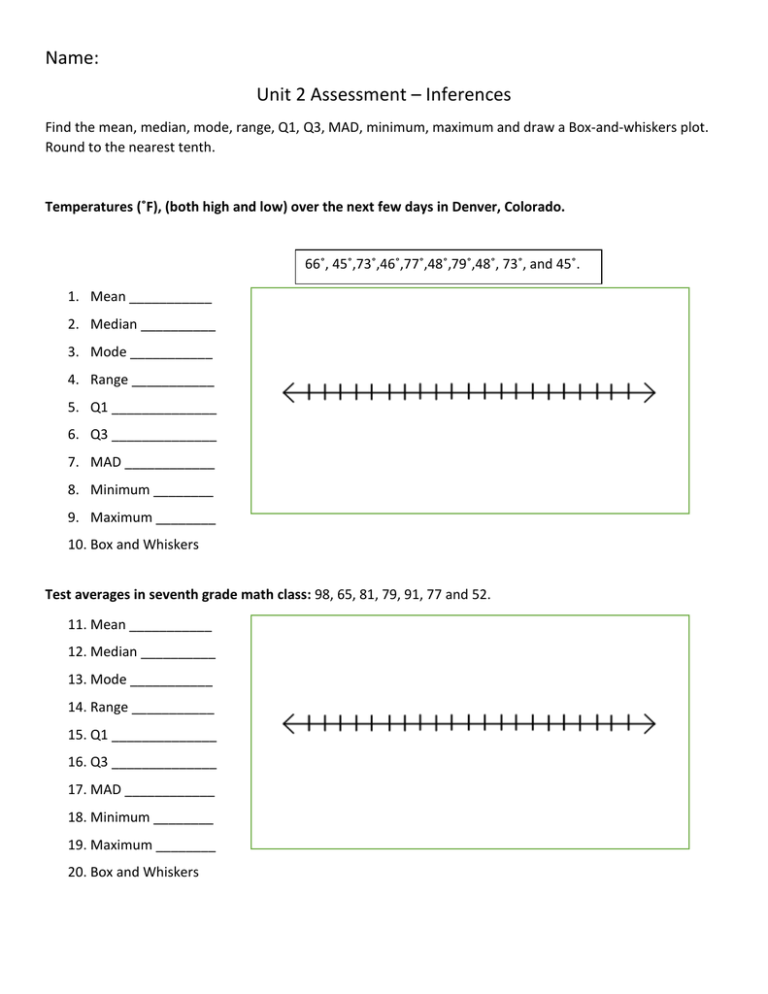
Name: Unit 2 Assessment – Inferences Find the mean, median, mode, range, Q1, Q3, MAD, minimum, maximum and draw a Box-and-whiskers plot. Round to the nearest tenth. Temperatures (˚F), (both high and low) over the next few days in Denver, Colorado. 66˚, 45˚,73˚,46˚,77˚,48˚,79˚,48˚, 73˚, and 45˚. 1. Mean ___________ 2. Median __________ 3. Mode ___________ 4. Range ___________ 5. Q1 ______________ 6. Q3 ______________ 7. MAD ____________ 8. Minimum ________ 9. Maximum ________ 10. Box and Whiskers Test averages in seventh grade math class: 98, 65, 81, 79, 91, 77 and 52. 11. Mean ___________ 12. Median __________ 13. Mode ___________ 14. Range ___________ 15. Q1 ______________ 16. Q3 ______________ 17. MAD ____________ 18. Minimum ________ 19. Maximum ________ 20. Box and Whiskers Tomato Plants: The heights (in inches) of eight tomato plants are 36, 45, 52, 40, 38, 41, 50 and 48. 21. Mean ___________ 22. Median __________ 23. Mode ___________ 24. Range ___________ 25. Q1 ______________ 26. Q3 ______________ 27. MAD ____________ 28. Minimum ________ 29. Maximum ________ 30. Box and Whiskers 31. The school newspaper is conducting a survey on the students’ favorite subject. Tell whether each sampling method is biased or not. Explain your answer. a. The newspaper surveys eighth grade students in a math class. ______________________________________________________________________________ ______________________________________________________________________________ ______________________________________________________________________________ b. The newspaper surveys every twentieth student entering school. ______________________________________________________________________________ ______________________________________________________________________________ ______________________________________________________________________________

