Total Dissolved Solids
advertisement
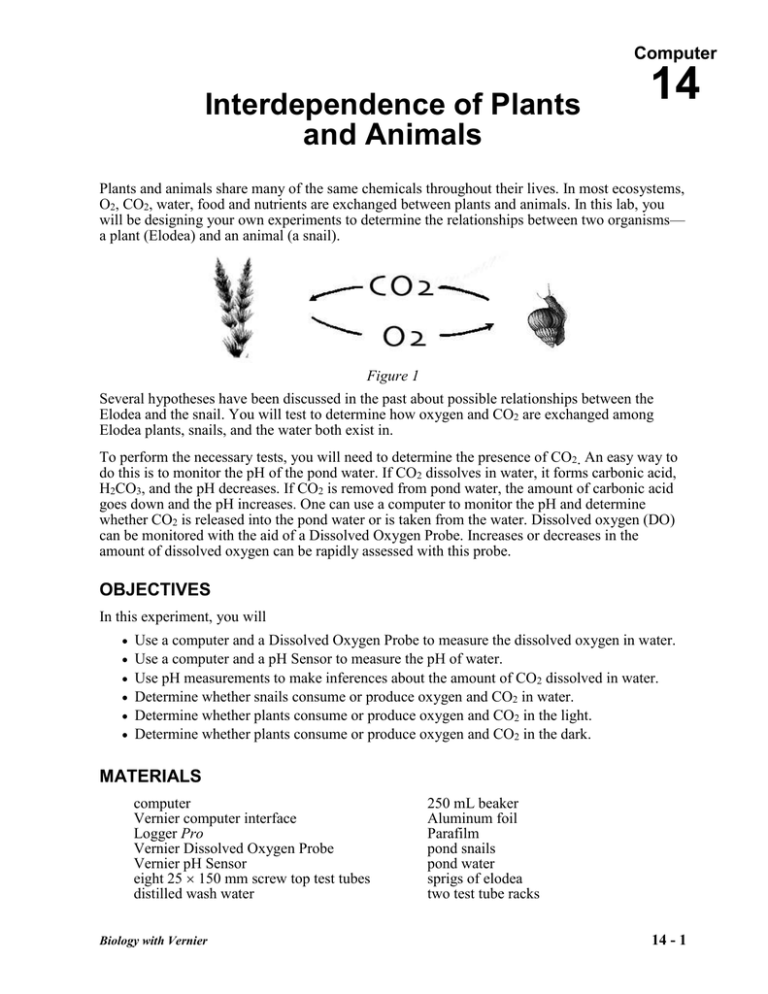
Computer Interdependence of Plants and Animals 14 Plants and animals share many of the same chemicals throughout their lives. In most ecosystems, O2, CO2, water, food and nutrients are exchanged between plants and animals. In this lab, you will be designing your own experiments to determine the relationships between two organisms— a plant (Elodea) and an animal (a snail). Figure 1 Several hypotheses have been discussed in the past about possible relationships between the Elodea and the snail. You will test to determine how oxygen and CO2 are exchanged among Elodea plants, snails, and the water both exist in. To perform the necessary tests, you will need to determine the presence of CO2. An easy way to do this is to monitor the pH of the pond water. If CO2 dissolves in water, it forms carbonic acid, H2CO3, and the pH decreases. If CO2 is removed from pond water, the amount of carbonic acid goes down and the pH increases. One can use a computer to monitor the pH and determine whether CO2 is released into the pond water or is taken from the water. Dissolved oxygen (DO) can be monitored with the aid of a Dissolved Oxygen Probe. Increases or decreases in the amount of dissolved oxygen can be rapidly assessed with this probe. OBJECTIVES In this experiment, you will Use a computer and a Dissolved Oxygen Probe to measure the dissolved oxygen in water. Use a computer and a pH Sensor to measure the pH of water. Use pH measurements to make inferences about the amount of CO2 dissolved in water. Determine whether snails consume or produce oxygen and CO2 in water. Determine whether plants consume or produce oxygen and CO2 in the light. Determine whether plants consume or produce oxygen and CO2 in the dark. MATERIALS computer Vernier computer interface Logger Pro Vernier Dissolved Oxygen Probe Vernier pH Sensor eight 25 150 mm screw top test tubes distilled wash water Biology with Vernier 250 mL beaker Aluminum foil Parafilm pond snails pond water sprigs of elodea two test tube racks 14 - 1 Computer 14 PRE-LAB PROCEDURE Important: Prior to each use, the Dissolved Oxygen Probe must warm up for a period of 10 minutes as described below. If the probe is not warmed up properly, inaccurate readings will result. Perform the following steps to prepare the Dissolved Oxygen Probe. 1. Prepare the Dissolved Oxygen Probe for use. a. b. c. d. e. Remove the blue protective cap. Unscrew the membrane cap from the tip of the probe. Using a pipet, fill the membrane cap with 1 mL of DO Electrode Filling Solution. Carefully thread the membrane cap back onto the electrode. Place the probe into a container of water. Remove membrane cap Add electrode filling solution Replace membrane cap Figure 2 2. Connect the Dissolved Oxygen Probe to Channel 2 of the Vernier interface. Connect the pH Sensor to Channel 1. 3. Prepare the computer for data collection by opening the file “14 Plants and Animals” from the Biology with Vernier folder of Logger Pro. Two meters will be displayed. The left one is set to read pH while the right one is set for dissolved oxygen in mg/L. 4. It is necessary to warm up the Dissolved Oxygen Probe for 5–10 minutes before taking readings. To warm up the probe, leave it connected to the interface, with Logger Pro running. The probe must stay connected at all times to keep it warmed up. If disconnected for a few minutes, it will be necessary to warm up the probe again. 5. You are now ready to calibrate the Dissolved Oxygen Probe. If your instructor directs you to use the calibration stored in the experiment file, then proceed to Step 6. If your instructor directs you to perform a new calibration for the Dissolved Oxygen Probe, use the procedure at the end of this lab. PROCEDURE Day 1 6. Obtain and wear an apron. 7. Obtain and label eight test tubes 1–8. 8. Set test tubes 1–4 in one test tube rack and test tubes 5–8 in a second test tube rack. 14 - 2 Biology with Vernier Interdependence of Plants and Animals 9. Fill each tube with pond water. 10. Place one snail each in test tubes 2, 4, 6, and 8. 11. Place one sprig of elodea in test tubes 3, 4, 7, and 8. Each set of four tubes should appear similar to those in Figure 3. Figure 3 12. Wrap test tubes 5–8 in aluminum foil to make each light tight. 13. Remove the pH Sensor from the storage bottle. Rinse the probe thoroughly with distilled water. Place the probe into test tube 1 and gently swirl to allow water to move past the probe’s tip. When the reading displayed in the meter stabilizes, record the pH value in Table 1. 14. Repeat Step 13 for each of the other seven test tubes. 15. When all of the pH readings have been taken, rinse the pH Sensor and return it to the pH storage bottle. 16. Place the Dissolved Oxygen Probe into test tube 1 so that it is submerged half the depth of the water. Gently and continuously move the probe up and down a distance of about 1 cm in the tube. This allows water to move past the probe’s tip. Note: Do not agitate the water, or oxygen from the atmosphere will mix into the water and cause erroneous readings. 17. When the dissolved oxygen reading stabilizes (~30 seconds), record its value in Table 1. 18. Repeat Steps 16–17 for each of the other seven test tubes. 19. When all of the dissolved oxygen readings have been taken, rinse the Dissolved Oxygen Probe and return it to the distilled water beaker. 20. Completely fill each test tube with pond water and tighten the cap onto the tube. Do not allow any air bubbles to remain in any of the test tubes. Unscrew each cap slightly, so that they just barely open. Wrap each tube with Parafilm so that they do not leak water. The Parafilm will expand, if necessary, to accommodate any pressure build-up in a tube. No oxygen or carbon dioxide should enter or leave a tube. 21. Place test tubes 1–8 near the light source, as directed by your instructor. Biology with Vernier 14 - 3 Computer 14 22. Predict how the pH and dissolved oxygen will change in each tube. Write a short statement that explains your reasoning. Be specific about the roles of both the snail and elodea. Be prepared to discuss your reasoning in class on Day 2. Day 2 23. Open the file saved on Day 1. Repeat Steps 1–6 to set up the pH Sensor and Dissolved Oxygen Probe. 24. Repeat Steps 13–21 to take pH and DO readings for each of the test tubes. 25. Now, the elodea will use the environment established by the snail and the snail will use the environment established by the elodea. Remove the snail from test tube 2 and the elodea from test tube 3. Place the snail in test tube 3 and the elodea in test tube 2. Note: Try not to aerate the water during the transfer. 26. Remove the snail from test tube 6 and the elodea from test tube 7. Place the snail in test tube 7 and the elodea in test tube 6. 27. Measure the pH and DO of test tubes 1–3 and test tubes 5–7. Record the results in Table 2. These values should be similar to those measured before the transfer. If not, the water may have been mixed too vigorously with the atmospheric air. 28. Completely fill test tubes 1–3 and test tubes 5–7 with water and tighten the cap onto each tube, as in Step 20. Wrap each slightly opened test tube with Parafilm. Place test tubes 1–3 and test tubes 5–7 near the light source, as in Step 21. 29. Return the snails and elodea from test tubes 4 and 8, as directed by your instructor. Clean and return the test tubes. Day 3 30. Repeat Steps 13–19 for test tubes 1–3 and 5–7. Record the results in Table 2. 31. Return the snails and elodea, as directed by your instructor. Clean and return the test tubes. 14 - 4 Biology with Vernier Interdependence of Plants and Animals DATA Table 1 Test Tube pH Day 1 pH Day 2 pH DO Day 1 DO Day 2 DO DO Day 2 DO Day 3 DO 1 2 3 4 5 6 7 8 Table 2 Test Tube pH Day 2 pH Day 3 pH 1 2 3 5 6 7 PROCESSING THE DATA 1. Calculate the change in pH for Tables 1–2. Record your results in Tables 1–2. 2. Calculate the change in dissolved oxygen for Tables 1–2. Record your results in Tables 1–2. QUESTIONS 1. Consider the snails. Comparing the readings from day 1 to day 2, answer the following questions: a. Do snails produce or consume CO2 when in the light? b. Do snails produce or consume oxygen when in the light? Biology with Vernier 14 - 5 Computer 14 c. Which test tubes allow you to answer this? Which test tube is the experimental test tube? Which test tube is the control test tube? d. Do snails produce or consume CO2 when in the dark? e. Do snails produce or consume oxygen when in the dark? f. Which test tubes allow you to answer this? Which test tube is the experimental test tube? Which test tube is the control test tube? 2. Consider the elodea. Comparing the readings from day 1 to day 2, answer the following questions: a. Do elodea produce or consume CO2 when in the light? b. Do elodea produce or consume oxygen when in the light? c. Which test tubes allow you to answer this? Which test tube is the experimental test tube? Which test tube is the control test tube? d. Do elodea produce or consume CO2 when in the dark? e. Do elodea produce or consume oxygen when in the dark? f. Which test tubes allow you to answer this? Which test tube is the experimental test tube? Which test tube is the control test tube? 3. Consider the elodea placed in the snail’s water on days 2–3. Comparing the readings from day 2 to day 3, answer the following questions: a. Do elodea produce or consume CO2 when in the light? b. Do elodea produce or consume oxygen when in the light? c. Which test tubes allow you to answer this? Which test tube is the experimental test tube? Which test tube is the control test tube? d. Do elodea produce or consume CO2 when in the dark? e. Do elodea produce or consume oxygen when in the dark? f. Which test tubes allow you to answer this? Which test tube is the experimental test tube? Which test tube is the control test tube? 4. Consider the snail placed in the elodea’s water on days 2–3. Comparing the readings from day 2 to day 3, answer the following questions: a. Do snails produce or consume CO2 when in the light? b. Do snails produce or consume oxygen when in the light? c. Which test tubes allow you to answer this? Which test tube is the experimental test tube? Which test tube is the control test tube? d. Do snails produce or consume CO2 when in the dark? e. Do snails produce or consume oxygen when in the dark? f. Which test tubes allow you to answer this? Which test tube is the experimental test tube? Which test tube is the control test tube? 5. Summarize the relationship between snails and plants in a pond. Explain your reasoning. 6. Interpret the results of Test Tube 4 and Test Tube 8. Compare your findings to the results obtained from Table 2. 7. How do your conclusions compare to your predictions in Step 22? 14 - 6 Biology with Vernier Interdependence of Plants and Animals CALIBRATION PROCEDURE 1. Perform the calibration. a. Choose Calibrate CH2: Dissolved Oxygen (mg/L) from the Experiment menu and then click . Zero-Oxygen Calibration Point b. Remove the probe from the water and place the tip of the probe into the Sodium Sulfite Calibration Solution. Important: No air bubbles can be trapped below the tip of the probe or the probe will sense an inaccurate dissolved oxygen level. If the voltage does not rapidly decrease, tap the side of the bottle with the probe to dislodge any bubbles. The readings should be in the 0.2 to 0.5 V range. c. Type 0 (the known value in mg/L) in the edit box. d. When the displayed voltage reading for Reading 1 stabilizes, click . Insert probe at an angle Saturated DO Calibration Point Submerge probe tip 1-2 cm e. Rinse the probe with distilled water and gently blot dry. f. Unscrew the lid of the calibration bottle provided with the probe. Slide the lid and the grommet about 2 cm onto the probe body. Screw lid and probe back onto bottle Insert probe into hole in grommet 1 cm of water in bottom g. Add water to the bottle to a depth of about 1 cm and screw the bottle into the cap, as shown. Important: Do not touch the membrane or get it wet during this step. Keep the probe in this position for about a minute. h. Type the correct saturated dissolved-oxygen value (in mg/L) from Table 3 (for example, 8.66) using the current barometric pressure and air temperature values. If you do not have the current air pressure, use Table 4 to estimate the air pressure at your altitude. i. When the displayed voltage reading for Reading 2 stabilizes (readings should be above 2.0 V), click . j. Choose Calibration Storage from the calibration pull-down menu. Choose Experiment File (calibration stored with the current document). Click . k. From the File menu, select Save As and save the current experiment file with a new name. Biology with Vernier 14 - 7 Computer 14 CALIBRATION TABLES Table 3: 100% Dissolved Oxygen Capacity (mg/L) 770 mm 760 mm 750 mm 740 mm 730 mm 720 mm 710 mm 700 mm 690 mm 680 mm 670 mm 660 mm 0°C 14.76 14.57 14.38 14.19 13.99 13.80 13.61 13.42 13.23 13.04 12.84 12.65 1°C 14.38 14.19 14.00 13.82 13.63 13.44 13.26 13.07 12.88 12.70 12.51 12.32 2°C 14.01 13.82 13.64 13.46 13.28 13.10 12.92 12.73 12.55 12.37 12.19 12.01 3°C 13.65 13.47 13.29 13.12 12.94 12.76 12.59 12.41 12.23 12.05 11.88 11.70 4°C 13.31 13.13 12.96 12.79 12.61 12.44 12.27 12.10 11.92 11.75 11.58 11.40 5°C 12.97 12.81 12.64 12.47 12.30 12.13 11.96 11.80 11.63 11.46 11.29 11.12 6°C 12.66 12.49 12.33 12.16 12.00 11.83 11.67 11.51 11.34 11.18 11.01 10.85 7°C 12.35 12.19 12.03 11.87 11.71 11.55 11.39 11.23 11.07 10.91 10.75 10.59 8°C 12.05 11.90 11.74 11.58 11.43 11.27 11.11 10.96 10.80 10.65 10.49 10.33 9°C 11.77 11.62 11.46 11.31 11.16 11.01 10.85 10.70 10.55 10.39 10.24 10.09 10°C 11.50 11.35 11.20 11.05 10.90 10.75 10.60 10.45 10.30 10.15 10.00 9.86 11°C 11.24 11.09 10.94 10.80 10.65 10.51 10.36 10.21 10.07 9.92 9.78 9.63 12°C 10.98 10.84 10.70 10.56 10.41 10.27 10.13 9.99 9.84 9.70 9.56 9.41 13°C 10.74 10.60 10.46 10.32 10.18 10.04 9.90 9.77 9.63 9.49 9.35 9.21 14°C 10.51 10.37 10.24 10.10 9.96 9.83 9.69 9.55 9.42 9.28 9.14 9.01 15°C 10.29 10.15 10.02 9.88 9.75 9.62 9.48 9.35 9.22 9.08 8.95 8.82 16°C 10.07 9.94 9.81 9.68 9.55 9.42 9.29 9.15 9.02 8.89 8.76 8.63 17°C 9.86 9.74 9.61 9.48 9.35 9.22 9.10 8.97 8.84 8.71 8.58 8.45 18°C 9.67 9.54 9.41 9.29 9.16 9.04 8.91 8.79 8.66 8.54 8.41 8.28 19°C 9.47 9.35 9.23 9.11 8.98 8.86 8.74 8.61 8.49 8.37 8.24 8.12 20°C 9.29 9.17 9.05 8.93 8.81 8.69 8.57 8.45 8.33 8.20 8.08 7.96 21°C 9.11 9.00 8.88 8.76 8.64 8.52 8.40 8.28 8.17 8.05 7.93 7.81 22°C 8.94 8.83 8.71 8.59 8.48 8.36 8.25 8.13 8.01 7.90 7.78 7.67 23°C 8.78 8.66 8.55 8.44 8.32 8.21 8.09 7.98 7.87 7.75 7.64 7.52 24°C 8.62 8.51 8.40 8.28 8.17 8.06 7.95 7.84 7.72 7.61 7.50 7.39 25°C 8.47 8.36 8.25 8.14 8.03 7.92 7.81 7.70 7.59 7.48 7.37 7.26 26°C 8.32 8.21 8.10 7.99 7.89 7.78 7.67 7.56 7.45 7.35 7.24 7.13 27°C 8.17 8.07 7.96 7.86 7.75 7.64 7.54 7.43 7.33 7.22 7.11 7.01 28°C 8.04 7.93 7.83 7.72 7.62 7.51 7.41 7.30 7.20 7.10 6.99 6.89 29°C 7.90 7.80 7.69 7.59 7.49 7.39 7.28 7.18 7.08 6.98 6.87 6.77 30°C 7.77 7.67 7.57 7.47 7.36 7.26 7.16 7.06 6.96 6.86 6.76 6.66 Table 4: Approximate Barometric Pressure at Different Elevations Elevation (m) 14 - 8 Pressure (mm Hg) Elevation (m) Pressure (mm Hg) Elevation (m) Pressure (mm Hg) 0 760 800 693 1600 628 100 748 900 685 1700 620 200 741 1000 676 1800 612 300 733 1100 669 1900 604 400 725 1200 661 2000 596 500 717 1300 652 2100 588 600 709 1400 643 2200 580 700 701 1500 636 2300 571 Biology with Vernier
