Date: ______ Period: ______ UNIT FOUR STUDY GUIDE
advertisement

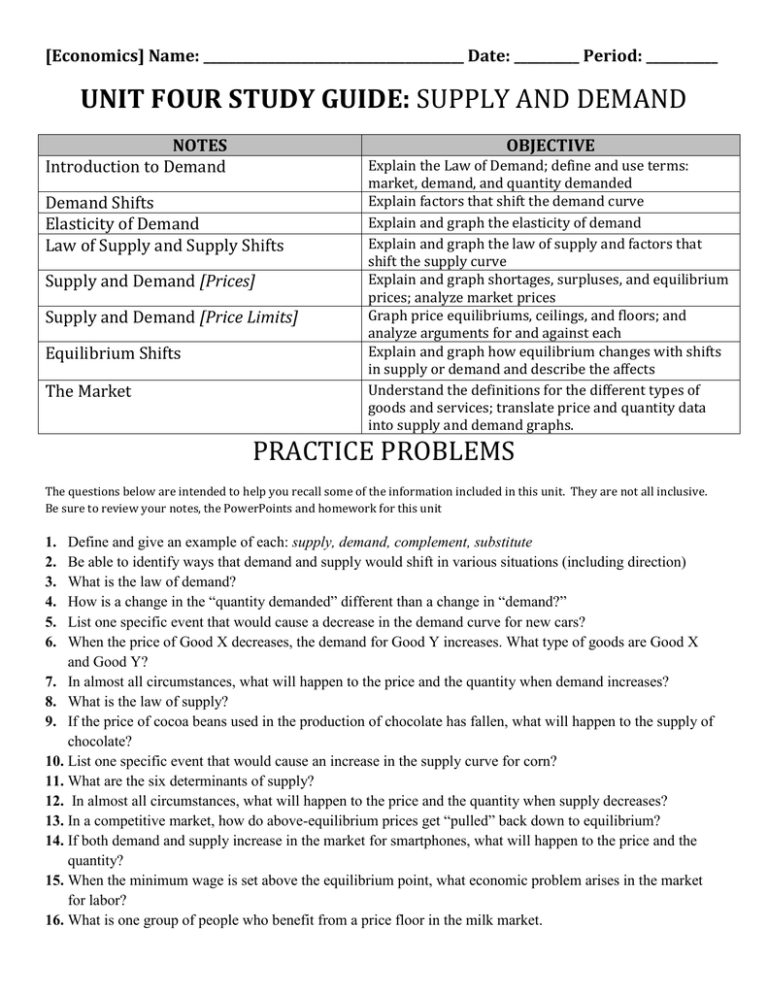
[Economics] Name: ________________________________________ Date: __________ Period: ___________ UNIT FOUR STUDY GUIDE: SUPPLY AND DEMAND NOTES Introduction to Demand OBJECTIVE Demand Shifts Elasticity of Demand Law of Supply and Supply Shifts Supply and Demand [Prices] Supply and Demand [Price Limits] Equilibrium Shifts The Market Explain the Law of Demand; define and use terms: market, demand, and quantity demanded Explain factors that shift the demand curve Explain and graph the elasticity of demand Explain and graph the law of supply and factors that shift the supply curve Explain and graph shortages, surpluses, and equilibrium prices; analyze market prices Graph price equilibriums, ceilings, and floors; and analyze arguments for and against each Explain and graph how equilibrium changes with shifts in supply or demand and describe the affects Understand the definitions for the different types of goods and services; translate price and quantity data into supply and demand graphs. PRACTICE PROBLEMS The questions below are intended to help you recall some of the information included in this unit. They are not all inclusive. Be sure to review your notes, the PowerPoints and homework for this unit 1. 2. 3. 4. 5. 6. Define and give an example of each: supply, demand, complement, substitute Be able to identify ways that demand and supply would shift in various situations (including direction) What is the law of demand? How is a change in the “quantity demanded” different than a change in “demand?” List one specific event that would cause a decrease in the demand curve for new cars? When the price of Good X decreases, the demand for Good Y increases. What type of goods are Good X and Good Y? 7. In almost all circumstances, what will happen to the price and the quantity when demand increases? 8. What is the law of supply? 9. If the price of cocoa beans used in the production of chocolate has fallen, what will happen to the supply of chocolate? 10. List one specific event that would cause an increase in the supply curve for corn? 11. What are the six determinants of supply? 12. In almost all circumstances, what will happen to the price and the quantity when supply decreases? 13. In a competitive market, how do above-equilibrium prices get “pulled” back down to equilibrium? 14. If both demand and supply increase in the market for smartphones, what will happen to the price and the quantity? 15. When the minimum wage is set above the equilibrium point, what economic problem arises in the market for labor? 16. What is one group of people who benefit from a price floor in the milk market. 17. List two reasons why economists think price controls are generally inefficient. 18. What happens when a government imposes a quota in a market? 19. What do price ceilings usually create? What do price floors usually create? 20. What are two factors that would cause demand to decrease and two that would increase supply: 21. Sketch the following S&D curve: What will happen to the equilibrium price of Chips Ahoy (currently $3.99), if Oreo cookies go on sale? 22. In the space below draw a S/D graph for Coca-Cola. Then imagine that Pepsi has a big sale on their soda. Draw the shift in demand for Coca-Cola. Be sure to label all parts of the graph 23. In the space below draw a S/D graph for Houses in the space below. Now let’s say that bricks used to build houses are cheaper than before. Draw the shift in the supply of houses. Be sure to label all parts! 24. In the space below draw a S/D graph for Apples in the space below. Now let’s say that five new apple orchards open up in Memphis. Draw the shift in the supply of apples. Be sure to label all parts! 25. What happened to the equilibrium price for apples? Is it higher or lower 26. What is the main difference between normal goods and inferior goods? 27. Name two goods that are considered substitutes for orange juice. 28. Name two goods that are considered complementary goods for computers. 29. What is the main difference between the “short run” and the “long run?” 30. Name two items that are necessary to include when drawing a market graph.


