wk1_23_tompkins_analysis - Indico
advertisement
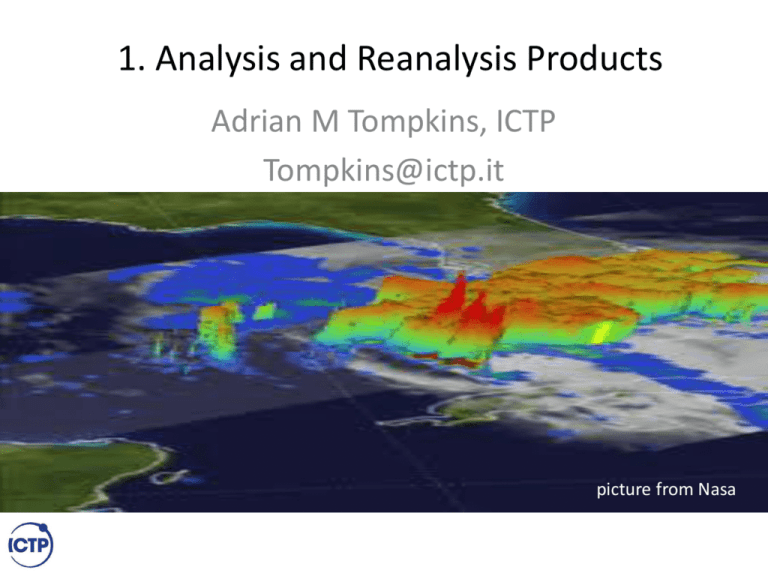
1. Analysis and Reanalysis Products Adrian M Tompkins, ICTP Tompkins@ictp.it picture from Nasa Climate impacts on society – Climate impacts are multifaceted and can occur over many timescales • Severe weather: floods, droughts • Impacts on health: – – – – Vector borne diseases Heat stress parasites Food security • Infrastructure, economy, sea level rise... – But how can we get climate data for the present day? Sources of data: stations For Satellite – coverage can be less of an issue (polar or geostationary – resolution, swathe, return times) Satellite – advantages and disadvantages What to use? What is best? But some variables in contrast are difficult to get directly from Satellite • Surface temperature: reliable over oceans using microwave. Some products over land, but uncertainty is large and not available daily • Winds: reasonable over oceans using scatterometer data, surface winds over lands not possible. Upper level winds from feature tracking (cloud, humidity) but uncertainties high. • Humidity: near surface only indirectly. • Take home message: most (near) surface variables over land very difficult to infer from remote sensing A supplement source of climate information: analysis and reanalysis • To make forecasts of the future weather, knowledge of the present state is required • This “picture” of the atmosphere needs to be “balanced” – Simple spatial and temporal interpolation of observations doesn’t work • Hence the development of analysis systems Use of a forecast model is required to obtain balanced state recipe in a nutshell 1. Make a short forecast from previous “analysis”, call the “control” recipe in a nutshell 2. Throw out “bad” data automatically departure too large recipe in a nutshell 3. Using a clever technique, find set of initial condition perturbations that minimize the departure of a revised LINEAR forecast from both the control and the set of “good” observations (translate model to observation space where necessary) Linear model recipe in a nutshell 4. Perform revised “control” forecast starting from this new initial condition recipe in a nutshell 5. Repeat step 1-4 until (if!) the process converges (e.g. 3 cycles) recipe in a nutshell 6. Now take any time point of the final “control” and use this as the “analysis” 06Z analysis 00Z 12Z analysis 06Z 12Z Fluxes and instaneous fields • Instaneous 06Z analysis fields such as e.g. T2m temperature are taken from the “analysis” • Pointless to do this for fluxes as can not calculate water and energy budgets – these are obtained 00Z from shortrange forecasts (0-24hrs) 12Z analysis fluxes – e.g. rainfall 06Z 12Z Advantages of analysis system • all observations contribute to all variables • Poor data can be automatically “sifted” M. TOMPKINS et al. over West Africa by Example: Data denialA.experiments conducted Tompkins et al. 2003 QJRMS: TABLE 2. Experiment 1 2 3 4 5 DATA DENIAL EXPERIMENTS Data denied Region Radiosonde, pilot and aircraft Radiosonde, pilot and aircraft Satellite Surface SYNOP and drift sondes All wind information Local Global Local Local Local ‘Local’ implies the region 0 to 30◦ N and from 30◦ W to 60◦ E. Observations assimilated in 2000 4 0 10 20 30 40 50 Relative Root mean square windHumidity errors –(%) compared to d) independent data Pressure (hPa) 500 600 local global 700 800 1000 0 5 day forecast Default analysis 900 8 Sonde data removed All winds removed 2 4 6 8 Zonal Wind (m s -1) Conclusion: Sonde temperature information more important for wind analysis than winds! But what is REanalysis? • Operational forecasting systems change their systems 3 or 4 times a year – New observation sources to be incorporated – Improvements to the physics in the forecast models – Improvements to the data assimilation techniques. • This means that the analyses are not “coherent” in time – e.g. Could a temperature trend be due to changes in data and/or assimilation system • One way to improve the coherency in reanalysis: The same system is run for all past dates. To give you an idea • Reanalysis of ERA-40 uses a model cycle that was operational in 2000 • Reanalysis of ERA-Interm uses a model cycle that was operational in approximately 2006 RE-analysis No Improvements in model and assimilation software – fixed at 2006 New platforms only til 2006 in general 1979 2006 present http://apps.ecmwf.int/datasets/data/interim_full_dail y/ • We will now try to download some fields using the reanalysis server • and post-process them using cdo
