AP Statistics: Correlation and Regression Lab
advertisement

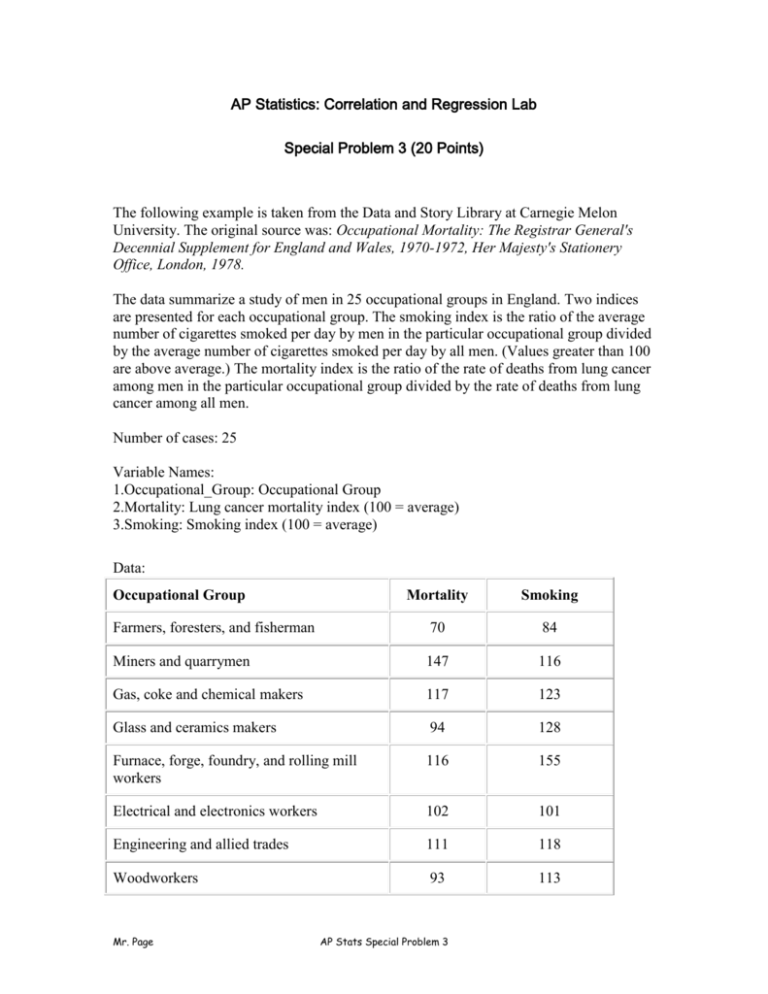
AP Statistics: Correlation and Regression Lab Special Problem 3 (20 Points) The following example is taken from the Data and Story Library at Carnegie Melon University. The original source was: Occupational Mortality: The Registrar General's Decennial Supplement for England and Wales, 1970-1972, Her Majesty's Stationery Office, London, 1978. The data summarize a study of men in 25 occupational groups in England. Two indices are presented for each occupational group. The smoking index is the ratio of the average number of cigarettes smoked per day by men in the particular occupational group divided by the average number of cigarettes smoked per day by all men. (Values greater than 100 are above average.) The mortality index is the ratio of the rate of deaths from lung cancer among men in the particular occupational group divided by the rate of deaths from lung cancer among all men. Number of cases: 25 Variable Names: 1.Occupational_Group: Occupational Group 2.Mortality: Lung cancer mortality index (100 = average) 3.Smoking: Smoking index (100 = average) Data: Mortality Smoking Farmers, foresters, and fisherman 70 84 Miners and quarrymen 147 116 Gas, coke and chemical makers 117 123 Glass and ceramics makers 94 128 Furnace, forge, foundry, and rolling mill workers 116 155 Electrical and electronics workers 102 101 Engineering and allied trades 111 118 Woodworkers 93 113 Occupational Group Mr. Page AP Stats Special Problem 3 Leather workers 88 104 Textile workers 102 88 Clothing workers 91 104 Food, drink, and tobacco workers 104 129 Paper and printing workers 107 86 Makers of other products 112 96 Construction workers 113 144 Painters and decorators 110 139 Drivers of stationary engines, cranes, etc. 125 113 Laborers not included elsewhere 133 146 Transport and communications workers 115 128 Warehousemen, storekeepers, packers, and bottlers 105 115 Clerical workers 87 79 Sales workers 91 85 Service, sport, and recreation workers 100 120 Administrators and managers 86 60 Professionals, technical workers, and artists 66 51 Please write in complete sentences when possible. Explain yourself when necessary. Remember this is about mortals, not morals. a. Identify the explanatory and the response variables. b. Draw a scatterplot of the data. c. Create numerical summaries. d. Examine the scatterplot for overall patterns: address form, direction and strength. Mr. Page AP Stats Special Problem 3 e. Explain what r measures. Compute the correlation coefficient. f. Explain regression outliers, leverage points, and influential points. Then identify any possible outliers or influential observations. Perform analysis to substantiate your response. g. Find the least-squares regression line manually, use calculator to verify your answer. As always, define your variables! h. Write out the regression equation and use it to predict the Mortality score for the farmers… and minors… on the list based on the Smoking index. Show your substitution. i. Manually calculate the residuals for these two groups done in (h). j. Create a residual plot (label and scale). Make connections to your response to (d) and (e). Is there a pattern in your residual plot? What does this tell us? k. What does r2 tell you about this relationship? l. Answer the following questions about the design of the study: Mr. Page Why did the study focus only on men? Why do you think the researchers choose occupational groups as their unit of analysis? What might have caused the correlation to not have been higher? Should we play down the study because it has only 25 data points? How well does this analysis meet the requirements of causation (of lung cancer due to smoking)? AP Stats Special Problem 3


