Game Show Research Report
advertisement
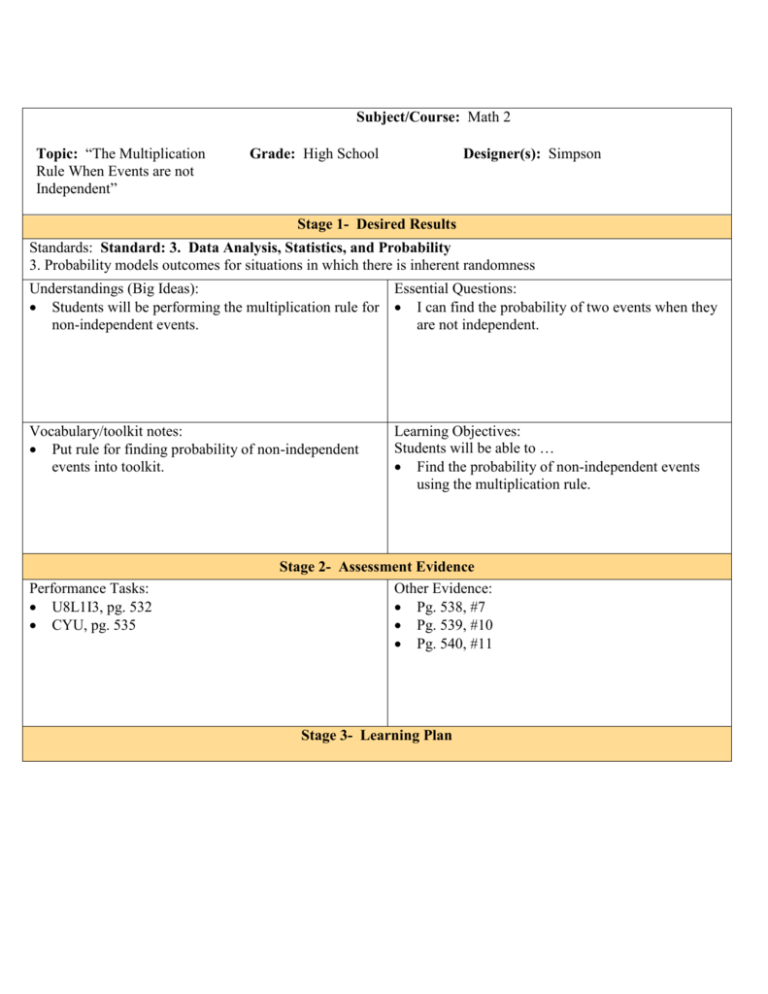
Subject/Course: Math 2 Topic: “The Multiplication Rule When Events are not Independent” Grade: High School Designer(s): Simpson Stage 1- Desired Results Standards: Standard: 3. Data Analysis, Statistics, and Probability 3. Probability models outcomes for situations in which there is inherent randomness Understandings (Big Ideas): Essential Questions: Students will be performing the multiplication rule for I can find the probability of two events when they non-independent events. are not independent. Vocabulary/toolkit notes: Put rule for finding probability of non-independent events into toolkit. Performance Tasks: U8L1I3, pg. 532 CYU, pg. 535 Learning Objectives: Students will be able to … Find the probability of non-independent events using the multiplication rule. Stage 2- Assessment Evidence Other Evidence: Pg. 538, #7 Pg. 539, #10 Pg. 540, #11 Stage 3- Learning Plan Where is the investigation headed? Final step in finding probability using multiplication rule. Hook the learner with engaging work. Equip for understanding, experience, and explore the big ideas. (prerequisites) Students need to be able to find conditional probability. Rethink options, revise ideas and work. (student misconception) Show/give the formula to students if needed after the investigations Evaluate your work and adjust as needed. The teacher will walk around answering questions and checking in on students and use the CYU as a measuring tool. Tailor the work to reflect individual needs, interests, and styles. Students get a wide variety of teaching tools from direct instruction to class discussion. Also students are allowed time to work individually as well as in a group. Organize the work flow to maximize in-depth understanding and success at the summative tasks. 1. Warm-up 2. As a class do and discuss the first problem 3. a. Teacher will explain how to find the probability of events using “and” with the multiplication rule. b. Put in notes both multiplication rules and independence 4. 5. Final Problem-Monty Hall Game description: This game is based on the old television show “Let’s Make a Deal” hosted by Monty Hall. At the end of each show, the contestant who had won the most money was invited to choose from among 3 doors: Door #1, Door #2, and Door #3. Behind one of the three doors was a very nice prize, let’s say a car. Behind the other 2 doors there was a goat. The contestant selected a door. Monty then revealed what was behind one of the OTHER doors (always a goat). The contestant was then offered a choice: stick with his current door, or switch to the remaining unrevealed door. He won what was behind his final choice of door. Before beginning the simulation, ask yourself: intuitively, does it make any difference to the chance of winning a car if the contestant switches of not? http://www.grand-illusions.com/simulator/montysim.htm Combine your data with your partner’s data. # of trials switched __________ # of cars won (after switching) # of trials “stuck” __________ # of cars won __________ (after “sticking”) total # of trials # of cars won (grand total) __________ __________ __________ Now pool the class results. Don’t double-count your data and your partner’s! # of trials switched __________ # of cars won (after switching) # of trials “stuck” __________ # of cars won __________ (after “sticking”) total # of trials # of cars won (grand total) __________ Questions: 1. What proportion of all trials resulted in a win? __________ __________ 2. What proportion of all “switch” trials resulted in a win? 3. What proportion of all “stick” trials resulted in a win? 4. What proportion of all wins (i.e., all cars) were the result of the switching strategy? What do these probabilities tell you about your intuitive answer? Does switching improve your chance of winning the car? Part II: MATHEMATICAL PROBABILITY We will now construct a tree diagram. First consider the “prize” behind the first door the contestant selects. This will form the first part of the tree diagram. The two options are “CAR” and “GOAT.” What is P(GOAT)? __________ What is the P(CAR)? __________ Second, consider the decision made by the contestant. This will form the second part of the tree diagram. The two options are “SWITCH” and “STICK.” To be fair in our calculations, we assume that the probability of switching is 0.5. Fill in the remaining probabilities and complete your tree diagram below. Finally, use the tree diagram: What is P(CAR|SWITCH)? ___________ Is there an advantage to switching? Does this agree with your original opinion? http://www.youtube.com/watch?v=mhlc7peGlGg Explanation of the Monty Hall problem Summative Assessment Plan Probability Summative Assessment Choose one of the following assessments to demonstrate your understanding of probability. 1. Take Home Unit Exam: students will complete a take-home exam showing their knowledge of probability 2. Game Show Research Report: you will research a popular television game show to find the theoretical probability of winning. Then you will watch at least 3 episodes and record the experimental results. Compare the theoretical probability to the experimental probability in each episode. Discuss the devise used in the game and discuss whether it is fair or unfair. Discuss the likelihood of a contestant winning the game. 3. Board Game Research Report: you will research a popular children’s’ board game show to find the theoretical probability of winning. Then you will play the board game three times and record the experimental results. Compare the theoretical probability to the experimental probability in each game. Discuss the devise used in the game and discuss whether it is fair or unfair. Discuss the likelihood of a contestant winning the game. 4. Design a Game: design a game using a fair device. Discuss the theoretical probability of winning the game. Play the game at least three times and record the experimental probability. Decide whether your game is fair or unfair. 5. Write a story: create a story which includes your understanding of events that are certain to happen, likely, unlikely, and impossible. ----------------------------------------------------------------------------------------------------------------------------------- I will complete the ____________________________________________________. Parent Signature_____________________________________________________ Date _____________________________ Probability Summative Assessment Rubric-Students Self-Assessment Take Home Exam MYP Criterion A: Knowledge and Understanding 0 1-2 I don’t understand anything and did not complete the test. I can solve simple probability problems. I can try to think mathematically if I have seen the problem before. 3-4 5-6 7-8 I can solve simple and more difficult probability problems. I can think mathematically sometimes if I have seen the problem before. I can solve challenging probability problems. I can think mathematically if I have seen these types of problems before. I can solve challenging probability problems. I always think mathematically correctly even if I have not seen that kind of problem before. Game Show Research Report, Board Game Research Report or Design a Game Reflection in Mathematics 0 I can’t explain anything in writing. 0 1-2 3-4 5-6 I tried to explain why my answers make sense. I try to explain the importance of probability in reallife. I correctly explain why my answer makes sense I can explain the importance of probability in real-life. . I can correctly explain why my answers make sense in details. I can explain the probability connection to real life in details. I offer suggestions or hints to make understanding easier for others. 1 2 3 4 Research My research is not evident. My research is not evident. I only use my prior knowledge and do not include any sources of information. My research may not be evident. I used sources but site them incorrectly. My research is evident. I used at least two reliable sources and site them correctly using MLA format. My research is evident. I used at least three reliable sources and site them correctly using MLA format. Content I did not address any of the questions/statements. I did not compare/contrast theoretical and experimental probabilities but may discuss the devise used, and the likelihood of the contestant winning. I left out important information. I compare/contrast theoretical and experimental probabilities, the devise used, and the likelihood of the contestant winning but may be missing some information. I compare/contrast theoretical and experimental probabilities, the devise used, and the likelihood of the contestant winning I compares/contrasts theoretical and experimental probabilities, the devise used, and the likelihood of the contestant winning and included additional . information. Presentation My report may is illegible or appears to be thrown together. My report is handwritten and may be difficult to read or missing important information such as title, name, period, and the name of the game researched, has many grammatical errors. My report is handwritten, includes title, name, period, name of game researched may not include tables, graphs and charts with explanations, may have some grammatical errors. My report is typed, includes title, name, period, name of game researched may not include tables, graphs and charts with explanations, may have a few grammatical errors but it is neatly stapled. My report is typed, includes title, name, period, name of game researched tables, graphs and charts with explanation, free of grammatical errors sand is neatly stapled. Write a Story or Write a Letter MYP Criterion C: Communication in Mathematics 0 I did not try to complete the assignment. 0 Content Grammar I did not try to complete the assignment. I did not try to complete the assignment. 1-2 I try to use some math vocabulary, but they may not be used correctly. I try to use pictures, diagrams or chats but I have a hard time explaining them. I try to explain but it may be confusing. 1 3-4 I use most math vocabulary correctly. If I use pictures, diagrams or charts, I can explain most of it in a way that makes some sense. 5-6 I use math vocabulary correctly to show I understand how math works. If I use pictures, diagrams or charts, I can explain all of it in writing. 2 3 4 My story/letter includes some math vocabulary terms. My story/letter appears to be written last minute. The story may include a character. The plot is undefined and undeveloped; the events of the story are unclear. My story/letter may lack in detail and may not make sense`. My story/letter includes some math vocabulary terms. The story includes one main character. The plot includes some important events, but may lack a climax, and/or resolution, My story/letter includes math vocabulary terms and reflects the students understanding of probability. My story/letter immediately grabs the readers attention, shows creativity through figurative language (such as similes, metaphors, hyperboles or personification) at least once. The story/letter includes math vocabulary terms and reflects the student’s accurate understanding of probability. In the story the main character is well developed. The plot includes several important events, a climax, and resolution. My story/letter has many grammatical and spelling errors. My story/letter has some grammatical and spelling errors. The story includes one main character. The plot includes several important events, a climax, and resolution. My story/letter has a few grammatical and spelling errors. My story/letter is free of grammatical and spelling errors.
