mitosis lab - local.brookings.k12.sd.us
advertisement
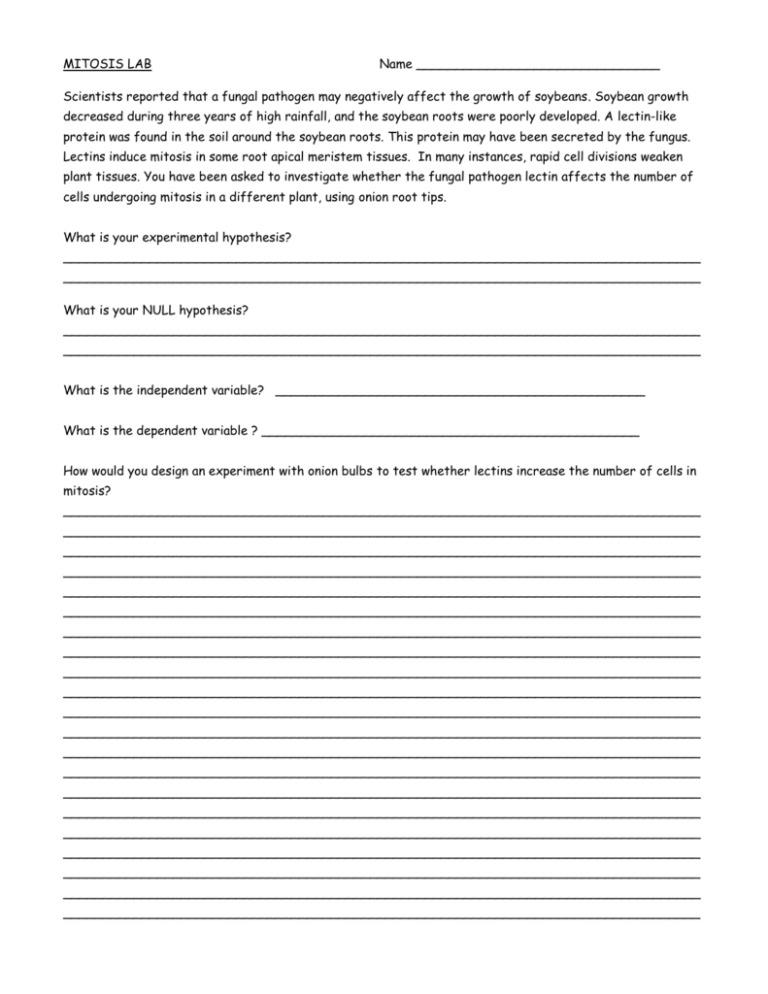
MITOSIS LAB Name _______________________________ Scientists reported that a fungal pathogen may negatively affect the growth of soybeans. Soybean growth decreased during three years of high rainfall, and the soybean roots were poorly developed. A lectin-like protein was found in the soil around the soybean roots. This protein may have been secreted by the fungus. Lectins induce mitosis in some root apical meristem tissues. In many instances, rapid cell divisions weaken plant tissues. You have been asked to investigate whether the fungal pathogen lectin affects the number of cells undergoing mitosis in a different plant, using onion root tips. What is your experimental hypothesis? _________________________________________________________________________________ _________________________________________________________________________________ What is your NULL hypothesis? _________________________________________________________________________________ _________________________________________________________________________________ What is the independent variable? _______________________________________________ What is the dependent variable ? ________________________________________________ How would you design an experiment with onion bulbs to test whether lectins increase the number of cells in mitosis? _________________________________________________________________________________ _________________________________________________________________________________ _________________________________________________________________________________ _________________________________________________________________________________ _________________________________________________________________________________ _________________________________________________________________________________ _________________________________________________________________________________ _________________________________________________________________________________ _________________________________________________________________________________ _________________________________________________________________________________ _________________________________________________________________________________ _________________________________________________________________________________ _________________________________________________________________________________ _________________________________________________________________________________ _________________________________________________________________________________ _________________________________________________________________________________ _________________________________________________________________________________ _________________________________________________________________________________ _________________________________________________________________________________ _________________________________________________________________________________ _________________________________________________________________________________ Circle and identify at least one cell showing each of the following phases: interphase, prophase, metaphase, anaphase, telophase, cytokinesis Data from this experiment is provided below: CLASS DATA GROUP CONTROL TREATED INTERPHASE 1055 2016 MITOTIC 762 1005 TOTAL 1817 3021 For this experiment, the number of treated cells in interphase and mitosis will be the OBSERVED (o) values. To find the expected values, calculate the percentage of cells in interphase and mitosis in the control group from the data provided. PERCENTAGES INTERPHASE MITOTIC TOTAL CONTROL TREATED 100% 100% Multiply the percentages by the total number of cells in the treated group; this will give the expected numbers (e). Calculate the chi-square ( X2 ) value for the experiment. TREATED OBSERVED EXPECTED o-e (o-e)2 (o-e)2 e INTERPHASE MITOTIC Σ = ________ Degrees of freedom = ____________ Critical value = ______________ CONCLUSION: Is there a significant difference in the mitotic rate between the treatment and control groups? What evidence is there to support your conclusion? _________________________________________________________________________________ _________________________________________________________________________________ _________________________________________________________________________________ _________________________________________________________________________________ _________________________________________________________________________________ _________________________________________________________________________________ _________________________________________________________________________________ _________________________________________________________________________________ _________________________________________________________________________________ _________________________________________________________________________________ MEIOSIS: Crossing over in Sordaria NAME _______________________________ The fungus Sordaria fimicola exchanges genetic material when two mycelia meet and fuse. The resulting zygote undergoes meiosis to produce asci; each ascus contains eight haploid spores. A single gene determines spore color. A cross was made between wild type (+;black) and tan (tn) strains. The resulting zygote produces either parental type asci, which have four black and four tan spores in a row (4:4 pattern) or recombinant asci, which do not have this pattern. What process that happens during prophase I of meiosis results in recombinant asci? _____________________________ MEIOSIS and CROSSING OVER IN SORDARIA Meiosis with NO crossing over DATA- Count asci on 3 cards CARD 1 CARD 2 CARD 3 TOTAL Meiosis WITH crossing over NUMBER OF ASCI SHOWING 4:4 PATTERN NUMBER OF ASCI SHOWING CROSSOVER (PARENTAL) (RECOMBINANTS) One map unit equals one recombinant per 100 total events. The percentage of asci showing crossover divided by 2 equals the map units in this activity. This is done because each spore produced by meiosis undergoes a mitotic division. LOOK AT THE LIFE CYCLE DIAGRAM FOR THIS FUNGUS. Which type of cell division is used to produce gametes? ___________________________ Which type of cell division is used to produce spores? _____________________________ How is this different from humans? ______________________________________________________ _________________________________________________________________________________ Why did you divide the % of asci showing crossovers by 2? _____________________________________ _________________________________________________________________________________ MAKE A CONNECTION: Use what you know about crossing over to predict the connection between the distance between two genes on a chromosome and their frequency of crossing over. ( Draw a picture below if that helps. ) _________________________________________________________________________________ _________________________________________________________________________________

