MR12 Lsn 69 - Forest Hills High School
advertisement
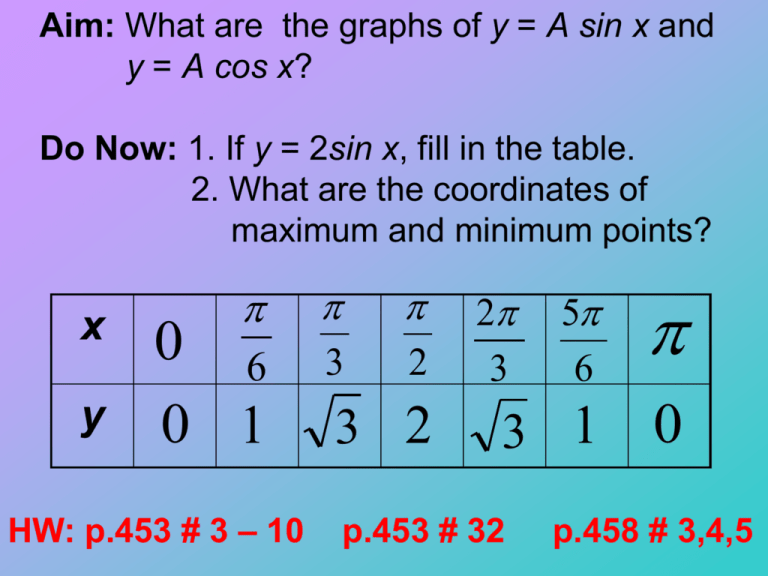
Aim: What are the graphs of y = A sin x and y = A cos x? Do Now: 1. If y = 2sin x, fill in the table. 2. What are the coordinates of maximum and minimum points? x y 6 0 0 1 HW: p.453 # 3 – 10 3 2 3 2 5 6 3 1 0 2 3 p.453 # 32 p.458 # 3,4,5 M at h Com poser 1. 1. 5 ht t p: / / www. m at hcom poser . com y 3.0 2.5 M at h Com poser 1. 1. 5 ht t p: / / www. m at hcom poser . com 2.0 M at h Com poser 1. 1. 5 ht t p: / / www. m at hcom poser . com 1.5 1.0 2 11 6 5 3 3 2 4 3 7 6 1 y = 2sin x 0.5 5 6 2 3 1 2 1 3 1 6 -0.5 1 6 1 3 1 2 2 3 5 6 1 7 6 4 3 3 2 -1.0 -1.5 -2.0 -2.5 -3.0 5 3 11 6 2 x y = 2sin x has the same basic pattern as y = sin x. The only difference is the range (the values of y) The maximum and minimum are higher and the value that causes these changes in high and low is known as the amplitude and it tells us how large the range will be. In a regular sine curve graph (y = sin x) the range is 1 y 1. When A (the amplitude) = 2, (y = 2 sin x) the range is 2 y 2. When A = 3 (y = 3sin x) the range is 3 y 3. Suppose A = -2. How will this affect the graph? The graph is the image of y = 2sin x reflected in the x-axis. This range is still 2 y 2 which means the amplitude is still 2. The graphs between y = 2 sin x and y = -2 sin x are just opposite to each other. Therefore, Amplitude = A . . The rules work exactly the same for cosine M at h Com poser 1. 1. 5 ht t p: / / www. m at hcom poser . com y 3.0 2.5 2.0 M at h Com poser 1. 1. 5 ht t p: / / www. m at hcom poser . com 1.5 M at h Com poser 1. 1. 5 ht t p: / / www. m at hcom poser . com 1.0 2 11 6 5 3 3 2 y = 2cos x 0.5 4 3 7 6 1 5 6 2 3 1 2 1 3 1 6 -0.5 1 6 1 3 1 2 2 3 5 6 1 -1.0 -1.5 -2.0 -2.5 -3.0 7 6 4 3 3 2 x 5 3 11 6 2 Graph y = 3cos x over 0 x 2 M at h Com poser 1. 1. 5 ht t p: / / www. m at hcom poser . com 3.0 y 2.5 2.0 1.5 1.0 0.5 2 11 6 5 3 3 2 4 3 7 6 1 5 6 2 3 1 2 1 3 1 6 -0.5 -1.0 -1.5 -2.0 -2.5 -3.0 x 1 6 1 3 1 2 2 3 5 6 1 7 6 4 3 3 2 5 3 11 6 2 Graph y = -2sin x over 2 x 2 M at h Com poser 1. 1. 5 ht t p: / / www. m at hcom poser . com 3.0 y 2.5 2.0 1.5 1.0 0.5 2 11 6 5 3 3 2 4 3 7 6 1 5 6 2 3 1 2 1 3 1 6 -0.5 -1.0 -1.5 -2.0 -2.5 -3.0 x 1 6 1 3 1 2 2 3 5 6 1 7 6 4 3 3 2 5 3 11 6 2 State the amplitude for the following functions a) y = -3sin x b) y = 4cos x 1 c) y sin x 3 3 d) y cos x 2 Write the equation according to the graph: 1. 2. y M at h Com poser 1. 1. 5 ht t p: / / www. m at hcom poser . com M at h Com poser 1. 1. 5 ht t p: / / www. m at hcom poser . com 2 y 2 1 1 -1 x x 1 2 1 3 2 -2 y 2 sin x 2 -1 1 2 1 3 2 2 -2 1 y cos x 2
