2016 Ardent Sentry & Cascadia Subduction Zone
advertisement
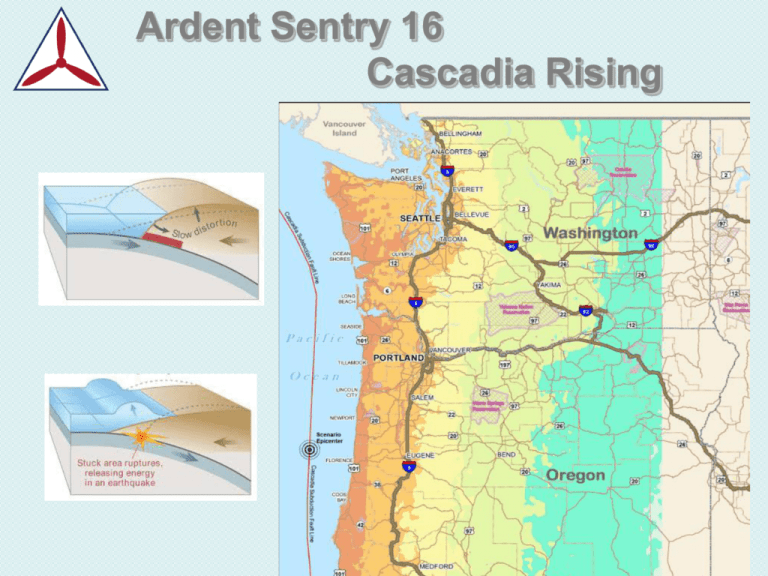
Ardent Sentry 16 Cascadia Rising ARDENT SENTRY EXERCISES ARDENT SENTRY is the annual major NORTHCOM exercise program. All agencies that are part of NORTHCOM participate annually. CAP has been an active major participant in ARDENT SENTRY since 2011. ARDENT SENTRY 11 – Earthquake on the New Madrid Seismic Zone ARDENT SENTRY 12 – Hurricane in Florida ARDENT SENTRY 13 - Hurricane in south Texas ARDENT SENTRY 14 – Earthquake in Alaska ARDENT SENTRY 15 – Earthquake in Southern California (San Andreas) ARDENT SENTRY 16 – Cascadia Rising Earthquake and Tsunami Ardent Sentry 16 CAP Planning Objectives Estimate/Quantify Scope of Response Define C&C external/internal to CAP Estimate impacts to local resources Develop Area Command concept to provide assets from outside impacted area Develop a Playbook for CAP portion of the response – tailored sections for Anchorage, Cascadia, SF Bay, SoCAL Pacific Region Cascadia Subduction Zone What is it? Ring of Fire The Ring of Fire accounts for 90% of all earthquakes, and 81% of the world’s largest earthquakes Subduction zones are shown in red The CSZ fault line is part of the Ring of Fire The CSZ is the only significant fault line on the Ring of Fire without a major quake in the last 50 years (see blue stars) Cascadia Subduction Zone The CSZ runs 800 miles from Southern British Columbia to Northern California, and lies 50 to 80 miles off the Pacific Coast The heavy Juan de Fuca plate is sliding under the lighter North American plate A magnitude 9.0 CSZ earthquake has occurred every 300 to 500 years (USGS – 400-600 years). The last CSZ earthquake occurred in the year 1700 (January 26). FEMA Modeling • FEMA commissioned a multi year *HITRAC & scientific study and produced the Region X Response Plan (Published December 2013) • Modeling Factors • February 6, 9:41am PST, weekday • Complete rupture of the CSZ fault line • Epicenter 60 miles off Oregon coast, 120 miles West of Eugene • M9.0 earthquake, with ground shaking up to 5 minutes • Tsunami wave heights 20 to 80 feet • Aftershocks of M7.0 or greater • Additional tsunamis caused by aftershocks Note: Damage caused by aftershocks, follow on tsunamis, and secondary effects is not included in damage estimates *HITRAC – Homeland Infrastructure Threat and Risk Analysis Center, the Department of Homeland Security (DHS) Infrastructure-intelligence fusion center. Schools There are approximately 2,286 schools in the affected area. Nearly 100% of schools West of the I-5 corridor suffer complete or severe damage, and are likely unusable. Schools along the I-5 corridor suffer a wide range of damage from complete to slight. Schools nearest the epicenter generally suffer the most significant damage resulting in limited capacity West of the I-5 corridor. Notable data: All of these schools are part of the National Sheltering System. Their loss indicates a corresponding reduction in sheltering capacity. Senior Living Facilities There are approximately 2,156 senior living facilities in the affected area. Nearly 100% of facilities West of the I-5 corridor suffer complete damage, and are likely unusable. The vast majority of facilities along the I-5 corridor suffer complete to severe damage and are likely unusable, or are significantly degraded. The facilities nearest the epicenter suffer most significant damage resulting in virtually no senior living facility capacity West of the I-5 corridor. Hospitals These are general locations and forecast status of the known Hospitals. There are 112 Hospitals in the affected area. 36% suffer severe damage, are unusable, and will likely be completely offline. 17% suffer moderate damage and are only assumed capable of 50% normal capacity. Total reduction is assumed to be 45% of total hospital capacity. 47% suffer slight damage and are able to continue to operate at capacity. The facilities nearer to the epicenter suffer most significant damage resulting in virtually no Hospital capacity west of the I5 corridor. Fire Stations These are general locations and forecast status of the known Fire Stations. There are 971 Fire Stations in the affected area. 30% suffer severe damage, are unusable, and are planned to be completely offline. 6% suffer moderate damage and are only assumed capable of 50% normal capacity. Total reduction is assumed to be 33% of Fire Response capability. 64% suffer slight or no damage and are able to continue to operate at capacity. The facilities nearer to the epicenter suffer most significant damage resulting in significantly reduced capability west of Shelton. Police Stations These are general locations and forecast status of the known Police Stations. There are 178 Police Stations in the affected area. 41% are completely destroyed, 7% suffer severe damage, are unusable, and are planned to be completely offline. 5% suffer moderate damage and are only assumed capable of 50% normal capacity. Total reduction is assumed to be 51% of Police Response capability. 48% suffer slight or no damage and are able to continue to operate at capacity. The facilities nearer to the epicenter suffer most significant damage resulting in significant degradation of Law Enforcement Sea, Rail, Air Most facilities west of the I-5 corridor suffer complete to severe damage Most facilities along the I-5 corridor suffer severe to moderate damage Most facilities east of the I-5 corridor suffer slight to no damage Many of these facilities are located in liquefaction zones Airports & Runways • Damage projections indicate that many airports may suffer significant infrastructure damage, but the runways may suffer less significant damage. • Nearly all infrastructure West of I5 corridor is destroyed or unusable. • Several runways are still useable, but will not have instrument capability and will require runway assessments prior to use. Bridges Virtually every highway crosses numerous bridges. Route identification that does not cross a bridge will not be possible when attempting to reach any isolated community. Bridges in the affected are predominantly old and were built prior to establishment of significant seismic building requirements. The assessment of bridges as early in the IAA process as possible will be key to the development of routes into isolated communities. Identifying bridges that need the least repairs will speed up recovery operations. The lack of suitable bridges will be a factor in the determination of the recovery efforts an d timelines. O UO Utilities •This slide provides an overview of the utilities networks across the affected area. In general the amount of damage decreases from West to East. Major networks will be out-of-service until significant repairs can be made. •There are approximately 440 major electrical facilities and a vast network of electrical power lines, both above and underground throughout the region. •There are 68 major Natural Gas facilities and 12 counties contain 22 major sections of NG pipe network. •There are 54 petroleum processing facilities, and 9 counties contain 16 major sections of petroleum pipeline. • There are 35 known Potable Water Facilities. Tsunami PNAS article: USGS,, University of Colorado, California State University. “The tsunami hazard zones in northern California, Oregon, and Washington that are associated with a CSZ earthquake contain 94,872 residents, 42,424 employees, 486 public venues, 440 dependent-care facilities, and 2,314 businesses with a significant customer presence.” CAP Response Any potential responders (professional and volunteer) will also be victims. Loss of critical infrastructure - roadways, bridges, viable runways, and fuel - will severely impact any response by WAWG and ORWG. Loss of aircraft – especially hangared. Airspace restrictions? Communications ? Repeaters? Any substantive CAP response will likely have to come from neighboring Wings-Regions. Capstone Project for PCR Operations: Plan or Playbook Aircraft Locations (FEMA Regions) Hurricane/Super Storm Sandy After Action/Lessons Learned Highlights CAP Response Highlights Tasked to collect airborne imagery, provide light air transportation, and assist in shelter management, and other general assistance in FEMA Regions I, II and III 250+ CAP members from 21 Wings supported ops 73 aircraft flew 1,407 hours on 696 sorties Provided 158,012 geo-tagged images Provided CAP liaison support to the NRCC as well as numerous states throughout the impacted area CAP’s response cost $181,771.75 Hurricane Sandy Resources Wing ICPs CAP Aircraft 22 Create Hot or Not Maps Area Comparison Maps Quote from New Yorker article 4,722 square miles Lane County Oregon Comparable to Connecticut in area ~ 1,500 square miles “In the Pacific Northwest, everything west of Interstate 5 covers some hundred and forty thousand square miles, including Seattle, Tacoma, Portland, Eugene, Salem (the capital city of Oregon), Olympia (the capital of Washington), and some seven million people” Critical Highways CAP Regions Rocky Mt. Region North Central Region Great Lakes Region Northeast Region Pacific Region Middle East Region Southwest Region Southeast Region HQ CAP (Maxwell AFB, Ala.) PRELIMINARY ESIMATES Aircraft Availability Aircraft Available Pre CSZ Aircraft Utilized Post CSZ Oregon 7 2 Washington 14 6 California 31 20 Nevada 14 7 Idaho 9 5 Utah 14 7 Montana 7 3 Wyoming 7 3 Colorado 16 8 Arizona 15 7 New Mexico 15 7 Total 149 75 Ardent Sentry 16 has Two Parts Day 0-4 Initial Response (June 7-10) Similar to AS 15 Day 10-14 Sustained Response (June 13-16) Expanded participation of other western wings 7 outside of Pacific Region Idaho Montana Wyoming Colorado Utah Arizona New Mexico UNCLASSIFIED Approved Exercise Objectives Defense of our Homelands Defense Support of Civil Authorities Homelands Partnerships Regional Partnerships Arctic Professionalism and Excellence Warfighters and Families 1. Exercise USNORTHCOM Cascadia Subduction Zone (CSZ) Catastrophic Earthquake & Tsunami Response Playbook 2. Exercise the command, control, and coordination (C3) structures required for a synchronized DOD response to a CSZ event 3. Exercise the rapid identification, approval, sourcing, and in-transit visibility of DOD capabilities in accordance with the USNORTHCOM CSZ Catastrophic Earthquake & Tsunami Response Playbook and in response to additional Lead Federal Agency requests 4. Exercise the sustainment of critical asset/supply requirements after the initial 5-7 days of the incident, and synchronize logistics support to the Federal response, as requested, and between Title 10 and National Guard forces (Title 32 and State Active Duty (SAD)) 5. Exercise DOD mission assurance for support of NORAD and USNORTHCOM missions UNCLASSIFIED UNCLASSIFIED AS 16 Exercise Execution Concept • AS 16 exercise execution: 7-16 June 2016 • 7-10 Jun: Part A - initial earthquake and tsunami “response” with DoD, Regional partners and FEMA HQ in ‘real time’ EQ event (E0) through event +3 days (E0 thru E+3) • 11-12 Jun: Time-bridge / scenario reset (E+4 thru E+9)* • 13-16 Jun: Part B - starts ten days post event; DoD is the primary training audience for theater sustainment planning and operations; State, Federal play is simulated (E+10 to E+13) Part A Key Storylines 7 Jun Tue E+0 8 Jun Wed E+1 Stand Down 9 Jun Thu E+2 • Immediate Response, SAR, Mission Assignments • Five day time-bridge and Scenario Reset • Command, Control and Coordination (C3), Sustainment, Logistics * VIGILANT GUARD; will not break or reset but play continually through 12 JUN 2015 UNCLASSIFIED 10 Jun Fri E+3 11 Jun Sat E+4 Part B 12 Jun Sun E+9 13 Jun Mon E+10 14 Jun Tue E+11 15 Jun Wed E+12 16 Jun Thu E+13 AS 16 Storylines Aerospace WG Storyline • Provide or arrange for timely DoD SAR and SAR services through Immediate Response, SAR coordinator, and DSCA methods OPR NC/J3 • State, Federal, DOD Incident Awareness N-NC/J2 and Assessment (IAA) • Evaluate WADS, CADS, and Northwest ACA bases’ C3 • Evaluate Northwest ACA bases infrastructure and its impact to supporting NORAD’s 3310/ONE mission requirement • Evaluate EADS’ ability to assume mission essential functions (MEFs) from WADS and the NFOC N/J3 N/J3 N/J3 • Patient movement (SAR/Medical WG) N-NC/SG • CAP Damage assessments, SAR assistance, Communication Support, and Sustainment. CAP 7 Jun Tue D+0 8 Jun Wed D+1 9 Jun Thu D+2 10 Jun Fri D+3 CSZ Playbook C3 structures Sourcing and ITV Sustainment Mission Assurance Stand Down 11 Jun 12 Jun Sat thru Sun D+4 D+9 13 Jun Mon D+10 14 Jun Tue D+11 15 Jun Wed D+12 16 Jun Thu D+13 What is a CAP Area Command? Name chosen to be consistent with NIMS concepts. Is not a command center over the Wing Incident Command Posts. Utilized when more than one wing is involved in responding to a disaster situation or when more than one wing is involved in responding to a major disaster within one wing. Provides coordination to assist in providing additional resources or personnel when a wing has exhausted its resources or personnel. Who authorizes a CAP Area Command? Authorized by the Region Commander whose Region is most affected by the disaster. If more than one Region is involved, the lead Region Commander will be the one whose Region is most affected by the disaster. Region Commander should not serve as the Area Commander. Region Commanders serve as the Agency Liaisons to be in a position to commit resources from their respective regions. Established with the concurrence of the NOC and 1AF. Should be funded by Mission Assignment (MA) from FEMA. What is a CAP Area Command Staff? Area Commander Preferably someone rated as an IC1. Should have experience dealing with a large disaster Deputy Area Commander Situation Awareness Specialists One for each three wings involved, depending on wing size Primary person on staff for dealing with the Wing ICPs Logistics Section Chiefs Finance-Admin Section Chief What are CAP Area Command responsibilities? Coordinate provision of additional resources and personnel as needed. Consolidate daily SITREPs from the Wing ICPs. Provide consolidated daily SITREP to FEMA NRCC CAP Desk, 1AF and NOC. Provide daily bed down report to 1AF. Where are they located? Far enough away from the disaster affected area to maintain the critical infrastructure. Phone service. Internet service. Cell phone service. Electric power. Prime location in each of the eight CAP Regions. Southeast Region – Dobbins Air Reserve Base, Atlanta, GA. Preferably at a military facility with lodging facilities. Locations should be established ahead of the need to respond to a disaster. AS 16 Summary AS 16 largest AS Exercise yet for CAP Part A and Part B Major role for wings east of Pacific Region Employ Area Command to Deploy western wing assets Establish inter-wing/inter-region working group to plan CAP response Actual event capacity Level of exercise participation Northcom developing plan for execution of SAR/CISAR - Working Group Meeting in Washington mid-October


![[#DASH-191] Replace JERSEY REST implementation by](http://s3.studylib.net/store/data/005918124_1-33fb89a22bdf4f7dbd73c3e1307d9f50-300x300.png)
