Name: Statistics Final Exam Review Your final exam will be in class
advertisement
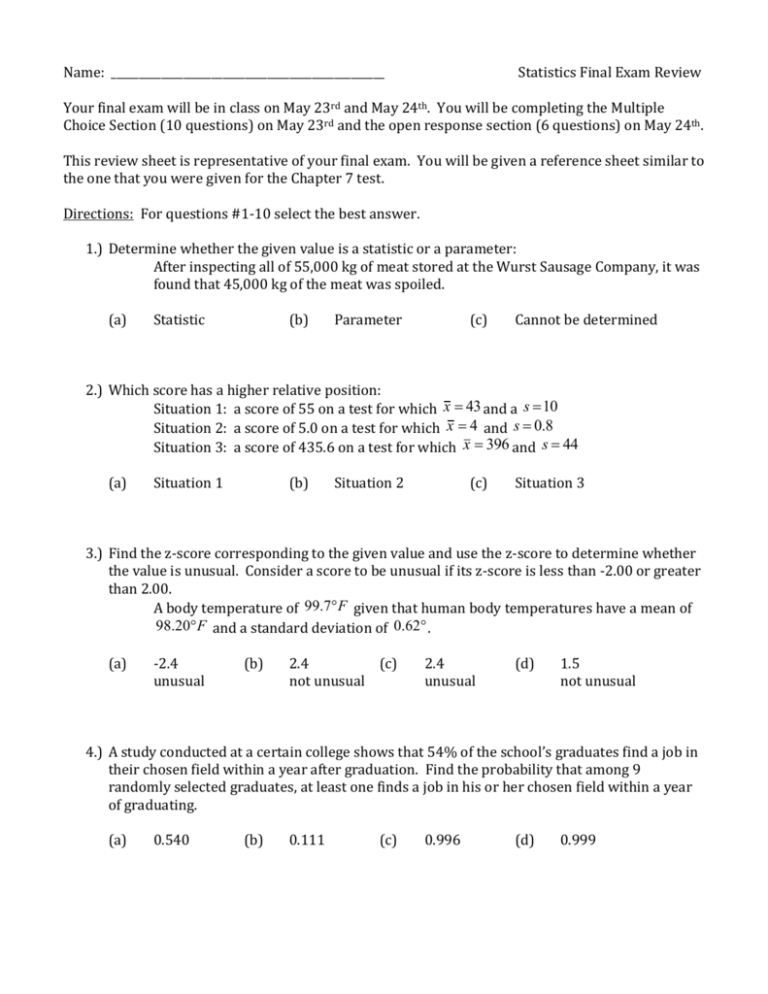
Name: _________________________________________________ Statistics Final Exam Review Your final exam will be in class on May 23rd and May 24th. You will be completing the Multiple Choice Section (10 questions) on May 23rd and the open response section (6 questions) on May 24th. This review sheet is representative of your final exam. You will be given a reference sheet similar to the one that you were given for the Chapter 7 test. Directions: For questions #1-10 select the best answer. 1.) Determine whether the given value is a statistic or a parameter: After inspecting all of 55,000 kg of meat stored at the Wurst Sausage Company, it was found that 45,000 kg of the meat was spoiled. (a) Statistic (b) Parameter (c) Cannot be determined 2.) Which score has a higher relative position: Situation 1: a score of 55 on a test for which x 43 and a s 10 Situation 2: a score of 5.0 on a test for which x 4 and s 0.8 Situation 3: a score of 435.6 on a test for which x 396 and s 44 (a) Situation 1 (b) Situation 2 (c) Situation 3 3.) Find the z-score corresponding to the given value and use the z-score to determine whether the value is unusual. Consider a score to be unusual if its z-score is less than -2.00 or greater than 2.00. A body temperature of 99.7F given that human body temperatures have a mean of 98.20F and a standard deviation of 0.62 . (a) -2.4 unusual (b) 2.4 (c) not unusual 2.4 unusual (d) 1.5 not unusual 4.) A study conducted at a certain college shows that 54% of the school’s graduates find a job in their chosen field within a year after graduation. Find the probability that among 9 randomly selected graduates, at least one finds a job in his or her chosen field within a year of graduating. (a) 0.540 (b) 0.111 (c) 0.996 (d) 0.999 5.) The following table contains data from a study of two airlines which fly to Small Town, USA. Number of Flights which were ON TIME Number of flights which were LATE Podunk Airlines 33 6 Upstate Airlines 43 5 If one of the 87 flights is randomly selected, find the probability that the flight selected arrived on time given that it was an Upstate Airlines flight. (a) 11 76 (b) 43 48 (c) 43 87 (d) 5 11 (d) 0.1660 6.) If Z is a standard normal variable, find P(Z 0.97) (a) 0.8078 (b) 0.8340 (c) 0.8315 7.) Assume that X has a normal distribution with 15.2 and the standard deviation of 0.9 . Find the probability that X is greater than 16.1. (a) 0.1550 (b) 0.1587 (c) 0.8413 (d) 0.1357 8.) Find the margin of error for the 95% confidence interval used to estimate the population proportion when n 186 and x 103. (a) 0.0643 (b) 0.125 (c) 0.00260 (d) 0.0714 9.) 61 randomly selected light bulbs were tested in a laboratory, 50 lasted more than 500 hours. Find the point estimate of the true proportion of all light bulbs that last more than 500 hours. (a) 0.803 (b) 0.450 (c) 0.820 (d) 0.180 10.) Given that the margin of error is E $100 and the standard deviation $403 , find the minimum sample size required to estimate an unknown population mean to a 95% confidence level. (a) 91 (b) 63 (c) 108 (d) 44 11.) Identify the sample and the population. Also, determine whether the sample is likely to be representative of the population. Situation: 100,000 randomly selected adults were asked whether they drink at least 48 oz of water each day and only 45% said yes. Sample: Population: Is the sample representative of the population? 12.) A researcher wants to obtain a sample of 100 school teacers from the 800 school teachers in the school district. Describe procedures for obtaining a sample of each type: Random: Systematic: Convenience: Stratified: Cluster: 13.) Describe how to find the percentile for a given score in a set of data. How does this relate to the definition of a percentile score? 14.) Construct the cumulative frequency and relative frequency distributions that corresponds to the given frequency distribution. Days of Vacation 0-3 16 4-7 20 8-11 14 12-15 24 16-19 26 CUMULATIVE FREQUENCY Days of Vacation Frequency Cumulative Frequency RELATIVE FREQUENCY Days of Vacation Relative Frequency 15.) When 343 college students are randomly selected and surveyed, it is found that 110 own a car. Construct a 99% confidence interval for the true proportion of all college students who own a car. Then interpret your confidence interval. Make sure you begin by checking that the necessary requirements are met. 16.) A group of 52 randomly selected students have a mean score of 20.2 with a standard deviation of 4.6 on a placement test. Assuming the population standard deviation is equal to that of our sample, construct a 90 percent confidence interval for the mean score, , of all students taking the test. Then interpret your confidence interval. Make sure you begin by checking that the necessary requirements are met.
