Grinband_Stroop_conflict
advertisement
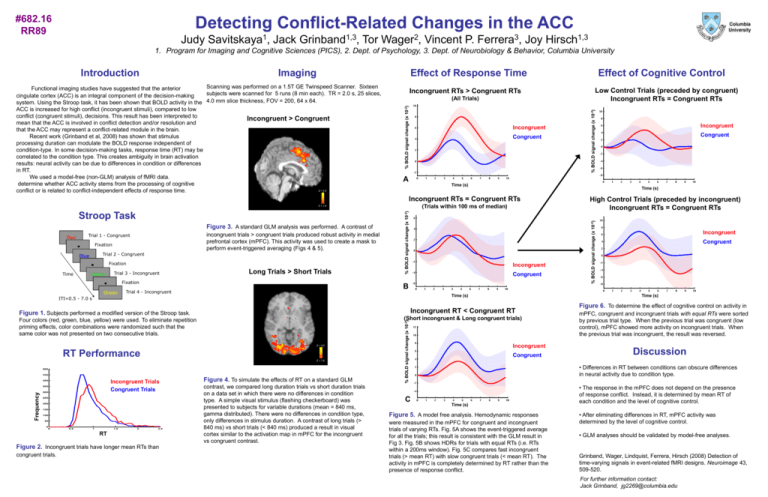
#682.16 RR89 Detecting Conflict-Related Changes in the ACC Judy Savitskaya1, Jack Grinband1,3, Tor Wager2, Vincent P. Ferrera3, Joy Hirsch1,3 1. Program for Imaging and Cognitive Sciences (PICS), 2. Dept. of Psychology, 3. Dept. of Neurobiology & Behavior, Columbia University Effect of Response Time Incongruent RTs > Congruent RTs (All Trials) Incongruent Congruent Time (s) Fixation incongruent trials > congruent trials produced robust activity in medial prefrontal cortex (mPFC). This activity was used to create a mask to perform event-triggered averaging (Figs 4 & 5). Trial 2 - Congruent Blue Fixation Time Yellow Trial 3 - Incongruent Long Trials > Short Trials Fixation Green % BOLD signal change (x 10-2) Red Trial 1 - Congruent Incongruent Congruent B Trial 4 - Incongruent Time (s) ITI=0.5 - 7.0 s Z = 4.0 RT Performance Z = 1.6 Frequency Incongruent Trials Congruent Trials RT Figure 2. Incongruent trials have longer mean RTs than congruent trials. Figure 4. To simulate the effects of RT on a standard GLM contrast, we compared long duration trials vs short duration trials on a data set in which there were no differences in condition type. A simple visual stimulus (flashing checkerboard) was presented to subjects for variable durations (mean = 840 ms, gamma distributed). There were no differences in condition type, only differences in stimulus duration. A contrast of long trials (> 840 ms) vs short trials (< 840 ms) produced a result in visual cortex similar to the activation map in mPFC for the incongruent vs congruent contrast. % BOLD signal change (x 10-2) (Short incongruent & Long congruent trials) Four colors (red, green, blue, yellow) were used. To eliminate repetition priming effects, color combinations were randomized such that the same color was not presented on two consecutive trials. C High Control Trials (preceded by incongruent) Incongruent RTs = Congruent RTs Incongruent Congruent Time (s) Incongruent RT < Congruent RT Figure 1. Subjects performed a modified version of the Stroop task. Congruent Time (s) (Trials within 100 ms of median) Z = 1.6 Figure 3. A standard GLM analysis was performed. A contrast of Incongruent A Incongruent RTs = Congruent RTs Stroop Task Low Control Trials (preceded by congruent) Incongruent RTs = Congruent RTs % BOLD signal change (x 10-2) Scanning was performed on a 1.5T GE Twinspeed Scanner. Sixteen Functional imaging studies have suggested that the anterior subjects were scanned for 5 runs (8 min each). TR = 2.0 s, 25 slices, cingulate cortex (ACC) is an integral component of the decision-making system. Using the Stroop task, it has been shown that BOLD activity in the 4.0 mm slice thickness, FOV = 200, 64 x 64. ACC is increased for high conflict (incongruent stimuli), compared to low conflict (congruent stimuli), decisions. This result has been interpreted to Incongruent > Congruent mean that the ACC is involved in conflict detection and/or resolution and that the ACC may represent a conflict-related module in the brain. Recent work (Grinband et al, 2008) has shown that stimulus processing duration can modulate the BOLD response independent of condition-type. In some decision-making tasks, response time (RT) may be correlated to the condition type. This creates ambiguity in brain activation results: neural activity can be due to differences in condition or differences in RT. We used a model-free (non-GLM) analysis of fMRI data. determine whether ACC activity stems from the processing of cognitive Z = 4.0 conflict or is related to conflict-independent effects of response time. Effect of Cognitive Control % BOLD signal change (x 10-2) Imaging % BOLD signal change (x 10-2) Introduction Incongruent Congruent Figure 6. To determine the effect of cognitive control on activity in mPFC, congruent and incongruent trials with equal RTs were sorted by previous trial type. When the previous trial was congruent (low control), mPFC showed more activity on incongruent trials. When the previous trial was incongruent, the result was reversed. Discussion • Differences in RT between conditions can obscure differences in neural activity due to condition type. Time (s) Figure 5. A model free analysis. Hemodynamic responses were measured in the mPFC for congruent and incongruent trials of varying RTs. Fig. 5A shows the event-triggered average for all the trials; this result is consistent with the GLM result in Fig 3. Fig. 5B shows HDRs for trials with equal RTs (i.e. RTs within a 200ms window). Fig. 5C compares fast incongruent trials (> mean RT) with slow congruent trials (< mean RT). The activity in mPFC is completely determined by RT rather than the presence of response conflict. • The response in the mPFC does not depend on the presence of response conflict. Instead, it is determined by mean RT of each condition and the level of cognitive control. • After eliminating differences in RT, mPFC activity was determined by the level of cognitive control. • GLM analyses should be validated by model-free analyses. Grinband, Wager, Lindquist, Ferrera, Hirsch (2008) Detection of time-varying signals in event-related fMRI designs. Neuroimage 43, 509-520. For further information contact: Jack Grinband, jg2269@columbia.edu
![[SZ+MA].](http://s3.studylib.net/store/data/009716128_1-5d7e208ec4c74700a98af14dc64b623b-300x300.png)
