Priority Families Programme – Progress Information as at the end of
advertisement
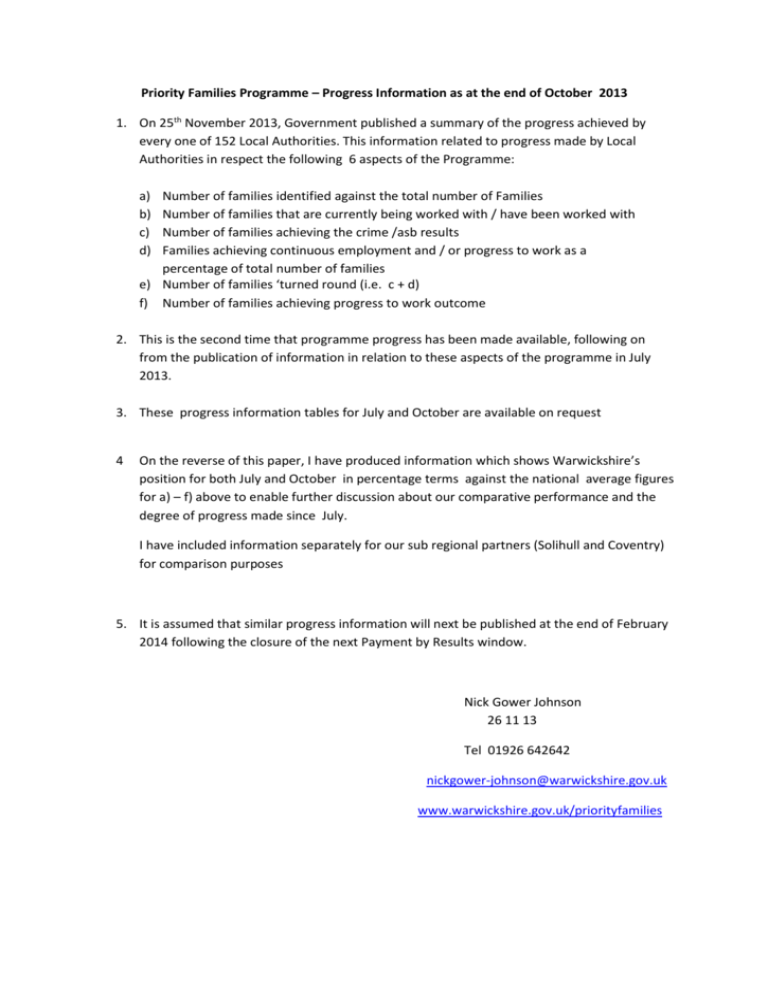
Priority Families Programme – Progress Information as at the end of October 2013 1. On 25th November 2013, Government published a summary of the progress achieved by every one of 152 Local Authorities. This information related to progress made by Local Authorities in respect the following 6 aspects of the Programme: a) b) c) d) Number of families identified against the total number of Families Number of families that are currently being worked with / have been worked with Number of families achieving the crime /asb results Families achieving continuous employment and / or progress to work as a percentage of total number of families e) Number of families ‘turned round (i.e. c + d) f) Number of families achieving progress to work outcome 2. This is the second time that programme progress has been made available, following on from the publication of information in relation to these aspects of the programme in July 2013. 3. These progress information tables for July and October are available on request 4 On the reverse of this paper, I have produced information which shows Warwickshire’s position for both July and October in percentage terms against the national average figures for a) – f) above to enable further discussion about our comparative performance and the degree of progress made since July. I have included information separately for our sub regional partners (Solihull and Coventry) for comparison purposes 5. It is assumed that similar progress information will next be published at the end of February 2014 following the closure of the next Payment by Results window. Nick Gower Johnson 26 11 13 Tel 01926 642642 nickgower-johnson@warwickshire.gov.uk www.warwickshire.gov.uk/priorityfamilies a) Families identified as a percentage of total number of families: October July 2013 2013 National Average 78.72% 67.7% Warwickshire 100% 79% Coventry 83.2% 83.2% Solihull 99% 79% b) Families worked with as a percentage of total number of families: October July 2013 2013 National Average 52.95% 42.3% Warwickshire 51.3% 38.3% Coventry 50.3% 30.2% Solihull 58% 33.5% c) Families achieving crime /asb & education outcome as a percentage of total number of families October July 2013 2013 National Average 18.7% 11.85% Warwickshire 13.16% 2.60% Coventry 15.9% 2.2% Solihull 12.2% 3.3% d) Families achieving continuous employment as a percentage of total number of families October July 2013 2013 National Average 1.21% 0.56% Warwickshire 0.62% 0.12% Coventry 1.10% 0.33% Solihull 1.40% 0.84% e) Total number of families turned round – i.e. c + d as a percentage of the total number of families National Average Warwickshire Coventry Solihull October 2013 18.70% 13.17% 15.9% 12.20% July 2013 11.85% 2.61% 2.20% 3.30% f) Number of families achieving progress to work outcome as a percentage of the total number of families October 2013 July 2013 National Average 1.71% 1.09% Warwickshire Coventry Solihull 3.10% 2.65% 0% 3.10% 0.33% 0%


