EXAM #2
advertisement
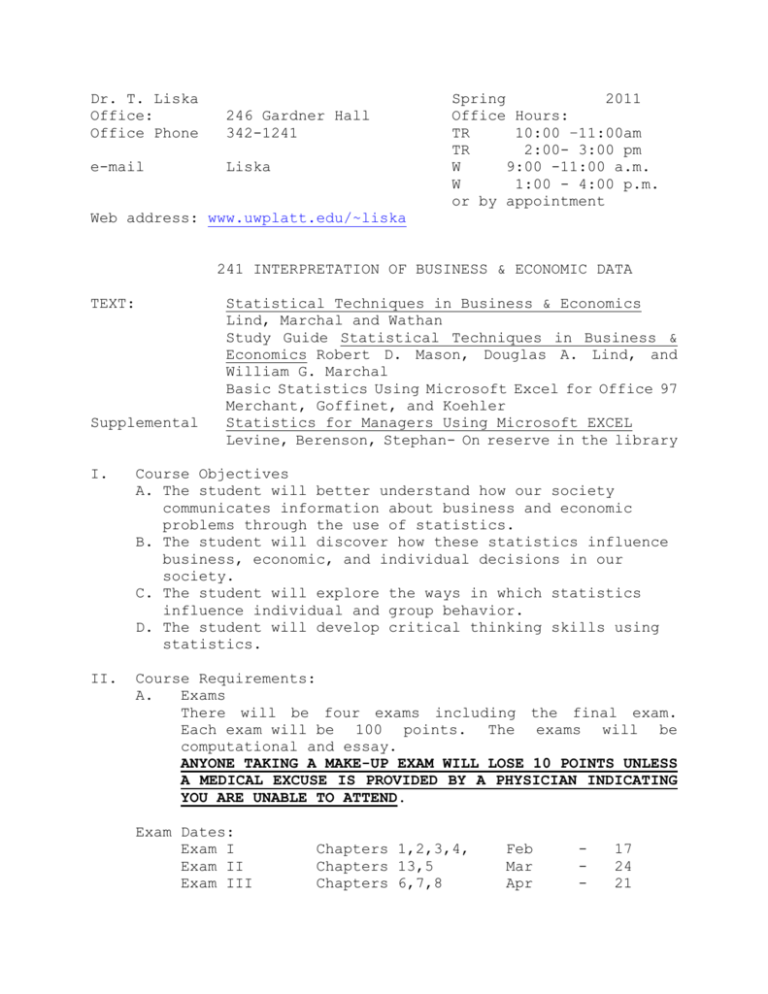
Dr. T. Liska Office: Office Phone 246 Gardner Hall 342-1241 e-mail Liska Spring 2011 Office Hours: TR 10:00 –11:00am TR 2:00- 3:00 pm W 9:00 -11:00 a.m. W 1:00 - 4:00 p.m. or by appointment Web address: www.uwplatt.edu/~liska 241 INTERPRETATION OF BUSINESS & ECONOMIC DATA TEXT: Supplemental Statistical Techniques in Business & Economics Lind, Marchal and Wathan Study Guide Statistical Techniques in Business & Economics Robert D. Mason, Douglas A. Lind, and William G. Marchal Basic Statistics Using Microsoft Excel for Office 97 Merchant, Goffinet, and Koehler Statistics for Managers Using Microsoft EXCEL Levine, Berenson, Stephan- On reserve in the library I. Course Objectives A. The student will better understand how our society communicates information about business and economic problems through the use of statistics. B. The student will discover how these statistics influence business, economic, and individual decisions in our society. C. The student will explore the ways in which statistics influence individual and group behavior. D. The student will develop critical thinking skills using statistics. II. Course Requirements: A. Exams There will be four exams including the final exam. Each exam will be 100 points. The exams will be computational and essay. ANYONE TAKING A MAKE-UP EXAM WILL LOSE 10 POINTS UNLESS A MEDICAL EXCUSE IS PROVIDED BY A PHYSICIAN INDICATING YOU ARE UNABLE TO ATTEND. Exam Dates: Exam I Exam II Exam III Chapters 1,2,3,4, Chapters 13,5 Chapters 6,7,8 Feb Mar Apr - 17 24 21 Final Exam Chapters 9,10,18 May 17 Final exam Tuesday May 17, 8:00-9:52 a.m. Room to be announced. The chapters assigned for each exam are tentative and are subject to change depending upon the pace of the class. Any student who may need an accommodation due to a disability, please make an appointment to see me during my office hours. A VISA from Services for Students with Disabilities authorizing your accommodations will be needed. Any student who may need an accommodation for a religious reason, please see me within the first two weeks of class How to succeed on exams: 1. Attend class. 2. Read the text carefully 3. Do as many odd problems as possible. 4. Ask questions. B. Assignments Class assignments will not be graded. A homework quiz will be given on one of the homework problems. The quiz will turned in at the beginning of class. If the student is absent, the student must make arrangements to come to my office and take a make-up quiz. The make-up quiz can come from any problem in the chapter. Assignment #1 Assignment #2 Assignment #3 Assignment #4 Assignment #5 Chapter Chapter Chapter 1 exercises 4, 6, 10 2 exercises 18,38,40,44, 3 exercises 14,(use integers and percentages as weights),20,28,46,52,56, 78 ,80 Chapter 4 exercises 14,22,26,34,40 Descriptive Statistics student survey Chapter 13 exercises 4,10,20,26,50 Student survey use multiple regression Ch 16 #4 Chapter 5 exercises 20,26,32,38,46,60,66,72,80 86, 88 3 Assignment #6 Assignment #7 Assignment #8 Assignment #9 Assignment#10 C. Chapter 6 Pg 756 #12 Chapter 7 Chapter 8 Chapter 9 Chapter 10 exercises 4,14,22,36,44,50,64 Draw an outcomes tree omit EVPI exercises 22,30,34,44,50,60,64 exercises 18,30,32,38,44 exercises 12,16,28,34,44,56 exercises 8,12,20,24 Bonus points Individuals can earn bonus points based on the schedule below. To earn bonus points the students must ask for a make up problem within 2 weeks from the time the exam was returned. The make-up problem will be similar to a problem on the exam the student had the greatest point deduction. The student must return the problem within 1 week. Possible Individual Bonus Points 60 or less 7 points 61 to 69 5 70 to 79 3 80 or above 2 ALL BONUS POINTS WILL BE ADDED TO YOUR TOTAL POINTS EARNED AT THE END OF THE SEMESTER D. Class Discussion Your participation in class will greatly enhance the learning process of you and your classmates. E. Class Project-optional You will be expected to accumulate data during the semester and analyze the data. The project will be divided into four parts as shown below: 1. Introduction - (first draft) March 29 - 10 pts. Explain what you plan to do and the statistical procedures you are going to use. If you plan to test a relationship between two variables, you should provide a brief explanation as to why you believe the two variables are related (i.e. what economic or business theory are you testing?). To receive credit for the introduction, a final draft 4 of the introduction must be included with your project on May 5, 2011. 2. Data -------------------------------------- 10 pts List your data and its source. You must submit your data on a excel file via e-mail to receive these points. I recommend you send the file as soon as you get your data on excel. If your data source is a survey you must submit all your survey responses. 3. Computations - - - - - - - - - - - - - - - 50 pts. This section must include the various statistical procedures we learned in class such as: mean, median, mode, minimum, maximum, mean absolute deviation, variance, standard deviation, histogram, frequency distribution, first and third quartiles, skewness, and advanced analysis. Advanced analysis will include at least one of the following techniques: regression analysis, or time series. All advanced analysis should include a hypothesis test. There will be a 10 point penalty for not e-mailing your excel file to me. 4. Analysis of your Data- - - - - - - - - - - - 20 pts. You should interpret all your descriptive statistics. You should also interpret your advanced analysis. If your project has a business or economic application, discuss its importance. 5. Originality/Application - - - - - - - - - - 10 pts. Are your findings consistent with or explainable by economic theory, orthodox business principles, or other a priori expectations? 6. Due Date -- - - - - - - - - - - - May 5, 2011 FIVE POINTS WILL BE DEDUCTED EACH LATE SCHOOL DAY. 10 point penalty if you do not submit a paper copy of your project. F. Potential Projects 1. Regression and Correlation 5 a. Analyze the relationship between season attendance and wins of your favorite sports b. Analyze the relationship between the change in the price of a stock and the change in a stock market index. c. If you are associated with a business and have access to sales, revenue or cost figures, a regression is possible. G. 2. Time Series a. Examine the relationship between sales and b. Examine the relationship between a stock price and time. 3. Sampling and Hypothesis Testing a. Conduct your own survey of Platteville students to determine the unemployment rate, hours Final Grade The final grade will be determined by total points that are accumulated through exams, quizzes and the 90% and above A 80% < 90% B 70% < 80% C 59% < 70% D Less than 59% F The final grade will be determine by the percent of points earned out of the total possible number of points. There are four grading options: 1. Exams only 400 points 2. Exams and project 500 points 3. Exams and homework quiz 550 points 4. Exams, homework quiz, and project 650 points The percent of total points necessary to receive an A,B,C,D, or F is shown above. For example if you choose option 1 you would need 360 points for an A. Should your total points come to 350 and you have 20 bonus points this would be a A. Should your total points (including bonus points) come to within 6 points of a grade boundary I will give you the higher grade if you have missed 3 or fewer classes for the semester. 6 H. How to succeed in this class 1. Attend class. 2. Read the text carefully 3. Do as many odd problems as possible. 4. Ask questions. III. Course Outline A. Introduction Ch 1 Week 1 B. Descriptive Statistics: Data Distributions Frequency Distributions Ch 2 Week 2 C. Descriptive Statistics: Ch 3 Week 3&4 EXAM #1 D. Measures of Dispersion E. Regression and Correlation Analysis of Time Series Trend Analysis Ch 4 Ch 13 Ch 19 Week 5 Week 6&7 EXAM #2 F. Probability Ch 5 1. Three Sources of Probability 2. Mathematics of Probability 3. Counting Techniques G. Discrete Probability Distributions Ch 6 1. Random Variables 2. Expected Values 3. Probability Distributions 4. Binomial Tables 5. Poisson Distribution 6. Poisson Table Week 7&8 Week 9 EXAM #3 H. The Normal Probability Distribution Week I. Sampling Methods and Sampling Distributions 1. Samples of Population Week 2. Probability Sampling Methods 3. Sampling Distribution of Sample Means 4. The Central Limit Theorem J. Estimation and Confidence Intervals Ch 9 Week K. One-Sample Tests of Hypothesis Ch 10 Week EXAM #4 10&11 Ch 8 12 13&14 15
