Define Phase - IE 203 Assignments
advertisement
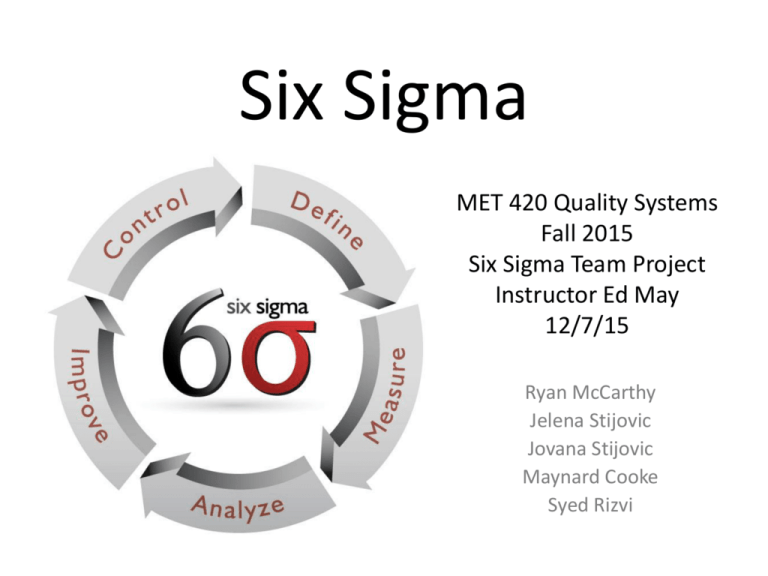
Six Sigma MET 420 Quality Systems Fall 2015 Six Sigma Team Project Instructor Ed May 12/7/15 Ryan McCarthy Jelena Stijovic Jovana Stijovic Maynard Cooke Syed Rizvi What is Six Sigma? • Six Sigma can be described as a business improvement approach. • It seeks to find and eliminate causes of defects and errors in manufacturing and service processes • Focuses on outputs which are critical to customers and on a clear financial return for the organization. • Continuous improvement • Reduction in variation from target • Reduction in defects The Fundamental Objective • The implementation of a measurement-based strategy • Focus on process improvement and variation reduction • Six Sigma improvement projects that follow DMAIC • DMAIC; define, measure, analyze, improve, control • Employees get six sigma training to get certified • Six Sigma is deployed with internal projects Goals • To reduce variation to no more than 3.4 defect parts per million on a long term basis. • Specify the process performance and come up with a strategy to reach the performance goals. • Decrease the variation around the mean value, increasing the sigma value from zero to six. • The process approaches zero variation that is known as zero defects. • The process is started by having employees go through different levels of six sigma training. • When employers have their employees trained the leadership capabilities are strengthened amongst the organization. Core Concepts • • • • • • • • • • Key business processes and customer requirements A clear focus on overall strategic objectives. Focus on sponsors responsible for championing projects Support team activities to help them with resistance to change. Emphasize measures that can be applied throughout an organization. Ensure that proper metrics are identified early in the process. Provide extensive training followed by project team deployment to improve profitability. Reduce non-value-added activities to achieve cycle time reductions. Create qualified process improvement experts who can apply improvement tools and lead teams. Set objectives for improvement. DMAIC • D – Define Phase: Define the project goals and customer. • M – Measure Phase: Measure to determine current performance, collect data. • A – Analyze Phase: Analyze and determine the root causes of the defects. • I – Improve Phase: Improve the process by eliminating defects. • C – Control Phase: Control process performance for continuous improvement. Define • • • • • • • Define the customers and their requirements Develop problem statements, goals and benefits Define Resources Evaluate key organizational support Develop project plan and milestones Identify the champion, process owner and team Develop high level process map Measure • Measure phase is critical as the team focuses on data collection. • Define Defect, Opportunity, Unit and Metrics • Detailed Process Map of Appropriate Areas • Develop Data Collection Plan • Validate the Measurement System • Collect the Data • Begin Developing Y=f(x) Relationship • Determine Process Capability and Sigma Baseline Analyze • • • • • Define Performance Objectives Identify Value/Non-Value Added Process Steps Identify Sources of Variation Determine Root Cause(s) Determine Vital Few x’s, Y=f(x) Relationship Improve • Perform Design of Experiments • Develop Potential Solutions • Define Operating Tolerances of Potential System • Assess Failure Modes of Potential Solutions • Validate Potential Improvement by Pilot Studies • Correct/Re-Evaluate Potential Solution Control • Define and Validate Monitoring and Control System • Develop Standards and Procedures • Implement Statistical Process Control • Determine Process Capability • Develop Transfer Plan, Handoff to Process Owner • Verify Benefits, Cost Savings/Avoidance, Profit Growth • Close Project, Finalize Documentation • Communicate to Business, Celebrate Benefits • • • • • • Better use of resources. High Employee Satisfaction. Better company reputation. More shareholder confidence. Business partnerships Improve. More productivity Statistical Basis • • • • • • Six Sigma = 3.4 DPMO, 99.9997% defect-free. Five Sigma = 233 DPMO, 99.98% defect-free Four Sigma = 6,210 DPMO, 99.4% defect-free Three Sigma = 66,807 DPMO, 93.3% defect-free Two Sigma = 308,538 DPMO, 69.1% defect-free One Sigma = 691,462 DPMO, 30.9% defect-free Reduction In Variation Sigma Shift Six Sigma Metrics • • • • • Defects Per Unit - DPU Defects Per Million Opportunities - DPMO Rolled Throughput Yield – RTY Cycle Time Cost of Poor Quality – COPQ Defects Per Unit The probability of getting 'r' defects in a sample having a given DPU rate can be predicted with the Poisson Distribution. Defects Per Million Opportunities Defects Per Million Opportunities or DPMO can be then converted to sigma values using Yield to Sigma Conversion Table Rolled Throughput Yield • The probability of the entire process producing zero defects. RTY = Process 1 TPY * Process 2 TPY * Process 3 TPY RTY = 0.800 * 0.739 * 0.804 RTY = 0.475 = 47.5% Cycle Time • Cycle time is the total time from the beginning to the end of your process • It includes process time, during which a unit is acted upon to bring it closer to an output • Delay time, during which a unit of work is spent waiting to take the next action. Cost Of Poor Quality • The cost caused by the gap between the desired and actual product/service quality. • The cost of lost opportunity due to the loss of resources used in rectifying the defect. • All the labor cost, rework cost, disposition costs, and material costs. • COPQ does not include detection and prevention cost. Origins and History • Bob Smith of Motorola developed a system of quality assurance which heavily featured the use of statistical tools. • This system aimed to achieve a sigma level of 6 or 99.99966% free of defects • Two years later in 1988 Motorola received the Malcolm Baldrige National Quality Award. • In 1995, CEO Jack Welch of General Electric implemented Six Sigma in his company to with great success. • Since then, Six Sigma has rapidly spread to many industrial businesses and helped greatly improve industrial quality around the world. History • Arguably the most important guru of Six Sigma is W. Edwards Deming. • He popularized statistical thinking and popularized the PDSA (Plan-Do-Study-Act) method which serve as the basis of Six Sigma. • PDSA is a systematic method of implementing changes to a process that works similarly to DMAIC History • Mikel Harry is considered the world’s foremost expert on Six Sigma • Having done more to spread and improve Six Sigma than anyone else. • He founded several Six Sigma institutions that provide a multitude of Six Sigma services • Helping businesses implement the system and researching advanced methods of quality assurance. Gurus • • • • • • • • • Frederick Winslow Taylor Walter A. Shewhart W. Edwards Deming Joseph M. Juran Armand V. Feigenbaum Kaoru Ishikawa Genichi Taguchi Philip B. Crosby Ed May Successful Usage • Six Sigma is applicable to virtually any business type. • Typically used by manufacturers to eliminate waste and reduce errors. • High consistency means fewer errors, as well as less money lost because of them. • Six Sigma is also highly beneficial to the service industry. Quality Tools • There are 7 basic quality control tools • Cause and Effect Diagram, Check Sheets, Control Charts, Histograms, Pareto Diagrams, Scatter Diagrams, Stratification or Run Charts Fishbone Diagram The fishbone diagram identifies many possible causes for an effect or problem. It can be used to structure a brainstorming session. It immediately sorts ideas into useful categories. Check Sheet A check sheet is a structured, prepared form for collecting and analyzing data. This is a generic tool that can be adapted for a wide variety of purposes. Control Charts The control chart is a graph used to study how a process changes over time. Data are plotted in time order. A control chart always has a central line for the average, an upper line for the upper control limit and a lower line for the lower control limit. Histogram A frequency distribution shows how often each different value in a set of data occurs. A histogram is the most commonly used graph to show frequency distributions. It looks very much like a bar chart, but there are important differences between them. Pareto Chart A Pareto chart is a bar graph. The lengths of the bars represent frequency or cost (time or money), and are arranged with longest bars on the left and the shortest to the right. In this way the chart visually depicts which situations are more significant. Scatter Diagram The scatter diagram graphs pairs of numerical data, with one variable on each axis, to look for a relationship between them. If the variables are correlated, the points will fall along a line or curve. The better the correlation, the tighter the points will hug the line Stratification Chart Stratification is a technique used in combination with other data analysis tools. When data from a variety of sources or categories have been lumped together, the meaning of the data can be impossible to see. This technique separates the data so that patterns can be seen. Run Chart A run chart is a graph that displays observed data in a time sequence. The data represents an aspect of the output of a manufacturing or business process. Run charts are an easy way to graphically summarize a seemingly random data set. Team Basics • Types – Continuous Improvement, Self Managed, Cross Functional • Stages – Forming, Storming, Norming, Performing, Adjourning, Partying • Decision Making Tools – Brainstorming, Multi Voting, Nominal Group • Communication Methods – Agendas, Minutes, Project Status Six Sigma Belts • The belts run on much the same concept as martial arts. Going from a White Belt at the bottom up to a Master Black Belt. The Black and Master Black Belt levels can be considered a master at the Six Sigma method. White Belt • White Belts are the least experienced of the belts. • They may only be aware of the procedures, policies, and the Six Sigma Goals, but do not directly contribute to them. Yellow Belt • The Yellow Belts can work as functional team members and can carry out the tasks they are given. • They can review, analyze, and suggest improvements for the projects they work on. • They are vital team members who will carry out the tasks assigned to them by team leaders. • They only work on a support level. Green Belt • The green belts are assistants to the higher belts. • They sometimes lead teams of their own on small projects. • They help analyze and collect data for their projects and for other team projects they are involved in. • The Green Belts are the individuals who do most of the actual ‘six sigma work’ within a company and often mentor Yellow and White Belts. Black Belt • The Black Belt is at the top level in Six Sigma, they practice leadership skills, design, develop, and run team projects utilizing the DMAIC model. Master Black Belt • The Master Black Belts have extensive experience and training in methodology. • They may train lower level belts or teach others about the methodology and preparing them for their own certifications. • Professionals who are having trouble or issues can go to someone holding this rank for help. Master Black Belt Requirements • To become certified as an ASQ MBB, a candidate must successfully meet all requirements. To be eligible to apply for the MBB examination, a candidate must hold a current ASQ Certified Six Sigma Black Belt (CSSBB). • A candidate must have either a minimum of 5 years experience in the role of a SSBB or MBB or to have completed at least 10 Six Sigma Black Belt projects. • Candidates must meet these minimum eligibility requirements in order to have their portfolio reviewed. Beginning a Project • When Six Sigma is implemented projects are created • These projects move through stages: Forming, Storming, Norming, Performing, and Adjourning Forming • Task and role clarification. • Learning about one another’s areas of expertise and preferred working methods. • Sharing all relevant information. • Encouraging members to ask questions of one another. • Establishing ground rules. • Using team-building exercises. Storming • Encouraging joint problem solving • Exploring different points of view. • Discuss the team’s decision-making process and share decision making responsibility. • Make sure team members state how they feel and what they think when they have an issue with a decision. Norming • • • • Talking openly about issues and concerns. Manage agenda items. Giving and requesting feedback. Solving challenging problems with group decisions. • Delegating responsibilities to the members capable of handling them. Performing • Setting challenging goals. • Looking for new opportunities to increase the team’s effectiveness. • Questioning assumptions and traditional ways of behaving. • Developing mechanisms for ongoing review by the team. • Recognizing each member’s contribution. • Developing members to their fullest potential through task assignments and feedback.

