Structured Notes Ch 1
advertisement
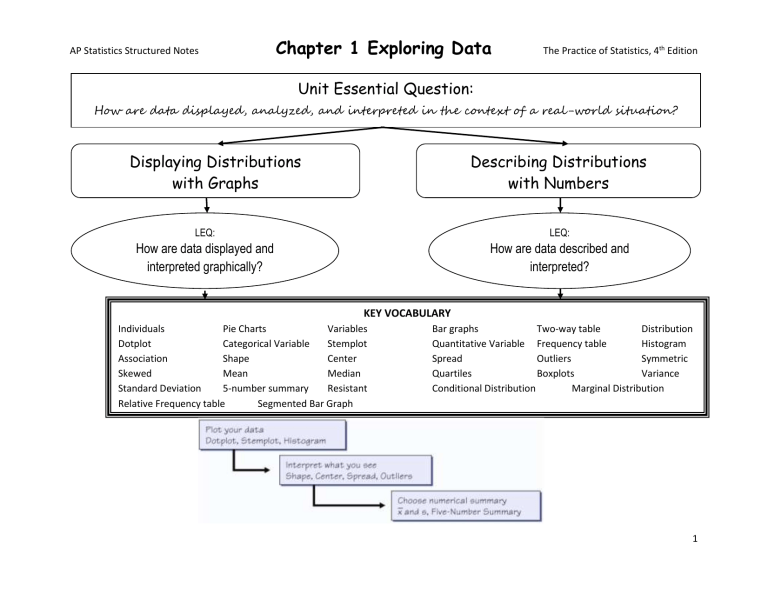
AP Statistics Structured Notes Chapter 1 Exploring Data The Practice of Statistics, 4th Edition Unit Essential Question: How are data displayed, analyzed, and interpreted in the context of a real-world situation? Displaying Distributions with Graphs Describing Distributions with Numbers LEQ: LEQ: How are data displayed and interpreted graphically? How are data described and interpreted? KEY VOCABULARY Individuals Pie Charts Variables Dotplot Categorical Variable Stemplot Association Shape Center Skewed Mean Median Standard Deviation 5-number summary Resistant Relative Frequency table Segmented Bar Graph Bar graphs Two-way table Distribution Quantitative Variable Frequency table Histogram Spread Outliers Symmetric Quartiles Boxplots Variance Conditional Distribution Marginal Distribution 1 AP Statistics Structured Notes Chapter 1 Exploring Data The Practice of Statistics, 4th Edition 1. What are the types of variables and how can you distinguish between them? 2. What is the pattern of variation of a variable? 3. What is inference? 4. What is the difference between a relative frequency table and a frequency table? 5. What types of graphs are appropriate for categorical data? 6. Why is it important when creating a bar graph to keep the bars equal width with equal spaces? 2 AP Statistics Structured Notes Chapter 1 Exploring Data The Practice of Statistics, 4th Edition 7. Why shouldn’t you replace the bars of a bar graph with pictures? 8. What do conditional distributions tell about the data? 9. What is a segmented bar graph? What is it used for? 10. Even a strong association between two variables can be influenced by other _______________ variables. 11. What is a dotplot? What is one advantage and one disadvantage of this type of graph? 12. S_________________________________________________ O_________________________________________________ C_________________________________________________ S_________________________________________________ 13. Draw an example of a symmetric graph. 14. Draw an example of a graph that is skewed left. 3 AP Statistics Structured Notes Chapter 1 Exploring Data The Practice of Statistics, 4th Edition 15. Draw an example of a graph that is skewed right. 16. What does it mean for a graph to be unimodal, bimodal, or multimodal? 17. What is an advantage and a disadvantage of using a stemplot? 18. Why would splitting stems in a stemplot be useful? 19. When is a back to back stemplot useful? 20. What is an advantage and a disadvantage of using a histogram? 21. What is 𝑥̅ ? How do you find its value? 22. What are the measures of center? 4 AP Statistics Structured Notes Chapter 1 Exploring Data The Practice of Statistics, 4th Edition 23. Explain why the median is resistant to extreme observations, but the median is nonresistant. 24. What is the spread of the middle half of the data called? How is it calculated? 25. When does an observation become an outlier? 26. What is the five-number summary? Why is it important? 27. What does standard deviation measure? 28. What is the relationship between variance and standard deviation? 29. Compare bar graphs and histograms. 30. Don’t forget to LABEL your graphs. 5 Chapter 1 Exploring Data AP Statistics Structured Notes MEAN The Practice of Statistics, 4th Edition MEDIAN Symbol: Paired with: When it is best to be used: Symbol: Paired with: When it is best to be used: AP RESPONSES ON THE AP TEST REQUIRE A “THINK-SHOW-TELL” APPROACH. This can be accomplished with the 4 step plan: 1. 2. 3. 4. State Plan Do Conclude 6
