Motion detector lab sheet
advertisement

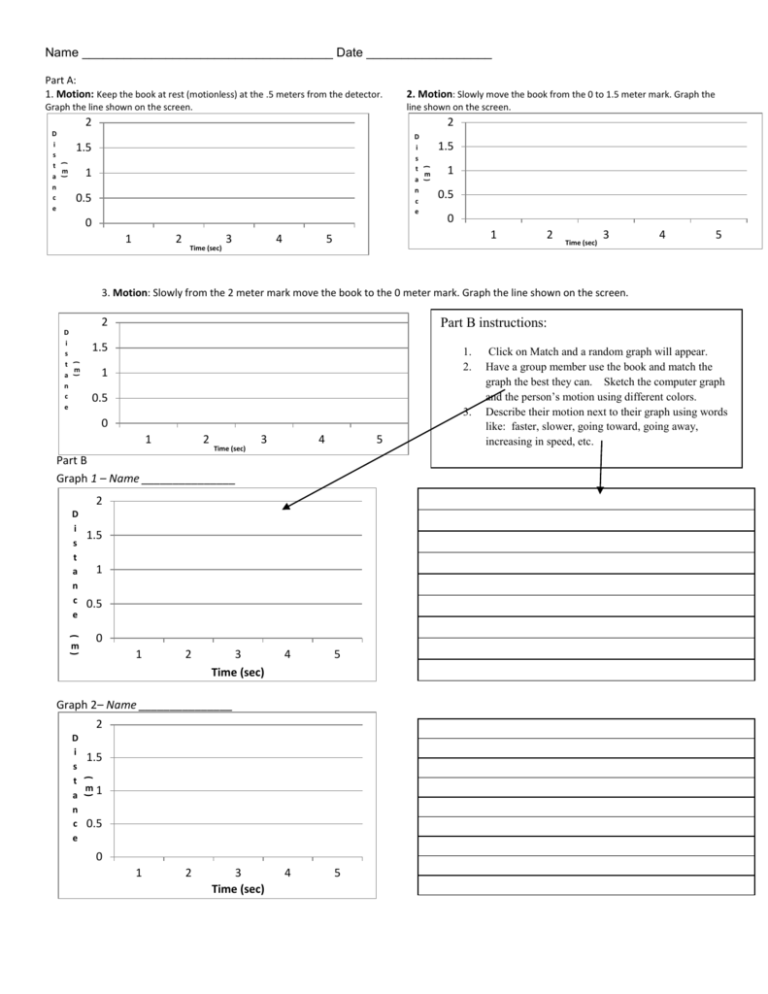
Name ____________________________________ Date __________________ Part A: 1. Motion: Keep the book at rest (motionless) at the .5 meters from the detector. 2. Motion: Slowly move the book from the 0 to 1.5 meter mark. Graph the Graph the line shown on the screen. line shown on the screen. 2 2 D i s t m a n c e 1.5 ( D i s t m a n c e ( ) 1 ) 1 1.5 0.5 0 1 2 Time (sec) 3 4 0.5 0 1 5 2 Time (sec) 3 4 5 3. Motion: Slowly from the 2 meter mark move the book to the 0 meter mark. Graph the line shown on the screen. 2 Part B instructions: 1.5 1. 2. ( D i s t m a n c e ) 1 0.5 3. 0 1 2 Time (sec) 3 4 5 Part B Graph 1 – Name _______________ 2 D i s t a n c e 1.5 1 0.5 ( 0 m ) 1 2 3 Time (sec) 4 5 4 5 Graph 2– Name _______________ 2 ( D i 1.5 s t m1 a n c 0.5 e ) 0 1 2 3 Time (sec) Click on Match and a random graph will appear. Have a group member use the book and match the graph the best they can. Sketch the computer graph and the person’s motion using different colors. Describe their motion next to their graph using words like: faster, slower, going toward, going away, increasing in speed, etc. Graph 3– Name _______________ 2 ( D i 1.5 s t m1 a n c 0.5 e ) 0 1 2 3 Time (sec) 4 5 4 5 Graph 4 – Name _______________ 2 ( D i 1.5 s t m1 a n 0.5 c e ) 0 1 2 3 Time (sec) Conclusion: 1. Describe the motion needed to make this graph: 2. In this activity you compared distance (position) to time. Explain how the graphs you created today could be used to explain instantaneous speed and average speed. 3. How would the graphs look if they graphed speed vs. time rather than distance vs. time? You may make a graph to help explain your ideas. Name ____________________________________ Date __________________ Graphing Your Motion – Lab 2 In this lab you will examine the way that the motion of an object changes and how that affects acceleration. You will use a motion detector to plot velocity versus time. Part A Velocity Open the file “33c Graphing Motion.” Slow Fast Start the book at the 0 m position facing the Motion Detector and the computer screen. Have your partner click “collect” and then slowly move the book backwards away from the Motion Detector. Sketch your results in the graph above labeled “slow”. Have two group members complete it (use a different color to represent their line). Repeat the previous step, this time moving faster. Sketch your results in the graph above labeled fast. Open the file “33d Graphing Motion.” You should see the following velocity vs. time graph. Try to match the line by moving toward or away from the Motion Detector. Sketch your results on the above graph. Have everyone in your group try to match the line, use a different color for each. PROCESSING THE DATA 1. Describe the difference between the lines created for each group member on the graphs made for slow and fast “Velocity vs. Time”. Explain why the lines are different. 2. What is the definition of velocity? 3. What did you have to do to match the graph you were given in “Match the Velocity”? How well does your graph match the given graph? 4. Explain how this graph would be different than the distance and time graphs created yesterday. Part B - Acceleration Open the file “33e Graphing Motion.” Start the book directly in front of the motion detector. Have your partner click “collect”. Keep the book still for about one second and then quickly pull the book to the 2m mark and stop. Say “stop” when you have stopped. As you say “stop,” your partner should click “stop”. Sketch your results. PROCESSING THE DATA (Part C) 1. How does the acceleration vs. time graph differ from the other two graphs? 2. On your velocity vs. time graph, label the acceleration and deceleration portions. 3. On your acceleration vs. time graph, label the acceleration and deceleration portions. 4. What is acceleration? 5. How can you see acceleration / deceleration in your graphs?


