ppt - InLight Solutions
advertisement
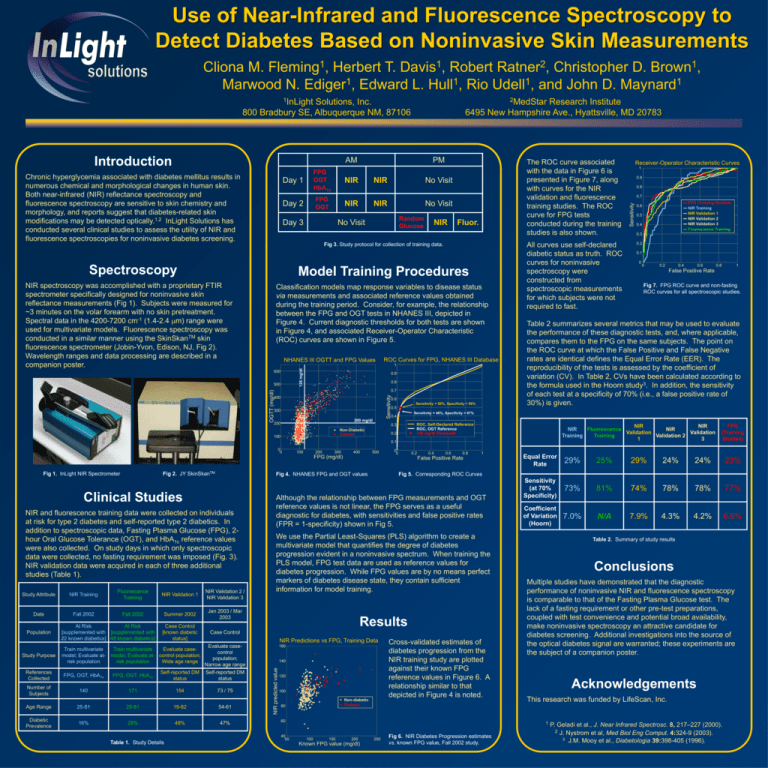
Use of Near-Infrared and Fluorescence Spectroscopy to Detect Diabetes Based on Noninvasive Skin Measurements 1 Fleming , 1 Davis , 2 Ratner , 1 Brown , Cliona M. Herbert T. Robert Christopher D. 1 1 1 1 Marwood N. Ediger , Edward L. Hull , Rio Udell , and John D. Maynard 1InLight 2MedStar Introduction Research Institute 6495 New Hampshire Ave., Hyattsville, MD 20783 AM Chronic hyperglycemia associated with diabetes mellitus results in numerous chemical and morphological changes in human skin. Both near-infrared (NIR) reflectance spectroscopy and fluorescence spectroscopy are sensitive to skin chemistry and morphology, and reports suggest that diabetes-related skin modifications may be detected optically.1,2 InLight Solutions has conducted several clinical studies to assess the utility of NIR and fluorescence spectroscopies for noninvasive diabetes screening. FPG OGT HbA1c Day 1 NIR FPG OGT Day 2 PM NIR NIR Day 3 The ROC curve associated with the data in Figure 6 is presented in Figure 7, along with curves for the NIR validation and fluorescence training studies. The ROC curve for FPG tests conducted during the training studies is also shown. No Visit NIR No Visit Random Glucose No Visit NIR Fluor. Fig 3. Study protocol for collection of training data. Spectroscopy Model Training Procedures NIR spectroscopy was accomplished with a proprietary FTIR spectrometer specifically designed for noninvasive skin reflectance measurements (Fig 1). Subjects were measured for ~3 minutes on the volar forearm with no skin pretreatment. Spectral data in the 4200-7200 cm-1 (1.4-2.4 mm) range were used for multivariate models. Fluorescence spectroscopy was conducted in a similar manner using the SkinSkanTM skin fluorescence spectrometer (Jobin-Yvon, Edison, NJ, Fig 2). Wavelength ranges and data processing are described in a companion poster. Classification models map response variables to disease status via measurements and associated reference values obtained during the training period. Consider, for example, the relationship between the FPG and OGT tests in NHANES III, depicted in Figure 4. Current diagnostic thresholds for both tests are shown in Figure 4, and associated Receiver-Operator Characteristic (ROC) curves are shown in Figure 5. NHANES III OGTT and FPG Values ROC Curves for FPG, NHANES III Database 126 mg/dl 1 600 500 0.9 0.8 Sensitivity OGTT (mg/dl) 0.7 400 0.6 Sensitivity = 50%, Specificity = 96% 0.5 300 200 mg/dl 100 100 200 300 400 0.2 500 FPG (mg/dl) Fig 2. JY SkinSkanTM Fig 1. InLight NIR Spectrometer Clinical Studies NIR and fluorescence training data were collected on individuals at risk for type 2 diabetes and self-reported type 2 diabetics. In addition to spectroscopic data, Fasting Plasma Glucose (FPG), 2hour Oral Glucose Tolerance (OGT), and HbA1c reference values were also collected. On study days in which only spectroscopic data were collected, no fasting requirement was imposed (Fig. 3). NIR validation data were acquired in each of three additional studies (Table 1). Date Population Study Purpose NIR Training Fall 2002 Fluorescence Training Fall 2002 At Risk At Risk [supplemented with [supplemented with 22 known diabetics] 48 known diabetics] Train multivariate model; Evaluate atrisk population NIR Validation 1 NIR Validation 2 / NIR Validation 3 Summer 2002 Jan 2003 / Mar 2003 Case Control [known diabetic status] Case Control FPG, OGT, HbA1c FPG, OGT, HbA1c Self-reported DM status Self-reported DM status Number of Subjects 140 171 154 73 / 75 Age Range 25-81 25-81 19-82 54-61 Diabetic Prevalence 16% 28% 48% 47% Table 1. Study Details 0.4 0.6 0.8 1 We use the Partial Least-Squares (PLS) algorithm to create a multivariate model that quantifies the degree of diabetes progression evident in a noninvasive spectrum. When training the PLS model, FPG test data are used as reference values for diabetes progression. While FPG values are by no means perfect markers of diabetes disease state, they contain sufficient information for model training. Results Evaluate caseTrain multivariate Evaluate casecontrol model; Evaluate at- control population; population; risk population Wide age range Narrow age range 160 140 120 100 Non-diabetic Diabetic 80 Cross-validated estimates of diabetes progression from the NIR training study are plotted against their known FPG reference values in Figure 6. A relationship similar to that depicted in Figure 4 is noted. 60 40 50 150 200 Known FPG value (mg/dl) FPG (Training Studies) NIR Training NIR Validation 1 NIR Validation 2 NIR Validation 3 Fluorescence Training 0.6 0.5 0.4 0.3 0.2 0.1 0 0 0.2 0.4 0.6 0.8 1 False Positive Rate Fig 7. FPG ROC curve and non-fasting ROC curves for all spectroscopic studies. FPG (Training Studies) Equal Error Rate 29% 25% 29% 24% 24% 23% Sensitivity (at 70% Specificity) 73% 81% 74% 78% 78% 77% Coefficient of Variation (Hoorn) 7.0% N/A 7.9% 4.3% 4.2% 6.6% Table 2. Summary of study results Conclusions Multiple studies have demonstrated that the diagnostic performance of noninvasive NIR and fluorescence spectroscopy is comparable to that of the Fasting Plasma Glucose test. The lack of a fasting requirement or other pre-test preparations, coupled with test convenience and potential broad availability, make noninvasive spectroscopy an attractive candidate for diabetes screening. Additional investigations into the source of the optical diabetes signal are warranted; these experiments are the subject of a companion poster. Acknowledgements This research was funded by LifeScan, Inc. 1 100 0.7 Fig 5. Corresponding ROC Curves NIR Predictions vs FPG, Training Data References Collected 0.2 Although the relationship between FPG measurements and OGT reference values is not linear, the FPG serves as a useful diagnostic for diabetes, with sensitivities and false positive rates (FPR = 1-specificity) shown in Fig 5. NIR predicted value Study Attribute 0 0 False Positive Rate Fig 4. NHANES FPG and OGT values 0.8 NIR NIR NIR Fluorescence NIR Validation Validation Training Training Validation 2 1 3 0.1 0 0 0.9 Table 2 summarizes several metrics that may be used to evaluate the performance of these diagnostic tests, and, where applicable, compares them to the FPG on the same subjects. The point on the ROC curve at which the False Positive and False Negative rates are identical defines the Equal Error Rate (EER). The reproducibility of the tests is assessed by the coefficient of variation (CV). In Table 2, CVs have been calculated according to the formula used in the Hoorn study3. In addition, the sensitivity of each test at a specificity of 70% (i.e., a false positive rate of 30%) is given. ROC, Self-Declared Reference ROC, OGT Reference 126 mg/dl Threshold 0.3 Non-Diabetic Diabetic 1 Sensitivity = 46%, Specificity = 97% 0.4 200 All curves use self-declared diabetic status as truth. ROC curves for noninvasive spectroscopy were constructed from spectroscopic measurements for which subjects were not required to fast. Receiver-Operator Characteristic Curves Sensitivity Solutions, Inc. 800 Bradbury SE, Albuquerque NM, 87106 250 Fig 6. NIR Diabetes Progression estimates vs. known FPG value, Fall 2002 study. P. Geladi et al., J. Near Infrared Spectrosc. 8, 217–227 (2000). 2 J. Nystrom et al, Med Biol Eng Comput. 4:324-9 (2003). 3 J.M. Mooy et al., Diabetologia 39:398-405 (1996).
