The Electrocardiogram
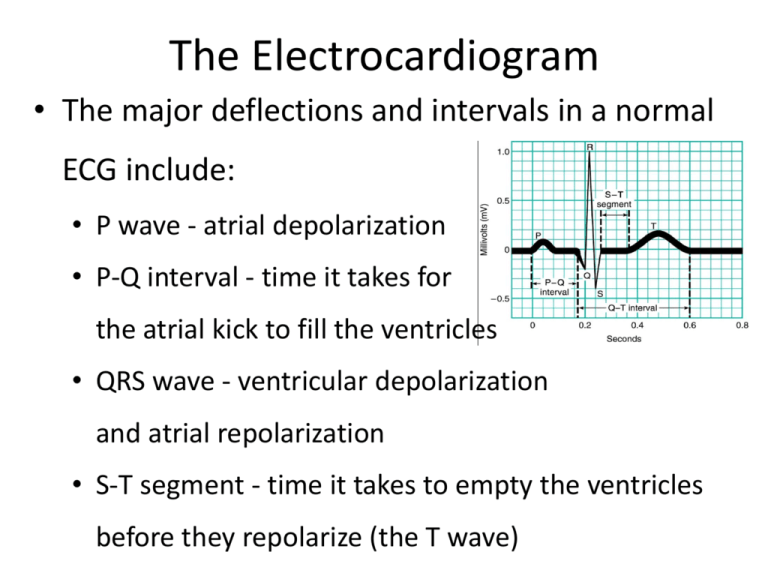
• The major deflections and intervals in a normal
ECG include:
• P wave - atrial depolarization
• P-Q interval - time it takes for
the atrial kick to fill the ventricles
• QRS wave - ventricular depolarization
and atrial repolarization
• S-T segment - time it takes to empty the ventricles
before they repolarize (the T wave)
1 Depolarization of atrial
contractile fibers
produces P wave
6
diastole
6 Ventricular
(relaxation)
P
Action potential
in SA node
0
2 Atrial systole
(contraction)
0.2
Seconds
P
P
0
0.2
0.4
0.6
0.8
Seconds
5 Repolarization
of
5
ventricular contractile
fibers produces T
wave
0
0.2
Seconds
3 Depolarization of
ventricular contractile
fibers produces QRS
complex
T
P
0
0.2
0.4
Seconds
R
0.6
4 Ventricular
systole
(contraction)
P
Q
0
P
0
0.2
0.4
Seconds
S
0.2
0.4
Seconds
The Electrocardiogram
(Interactions Animation)
• ECG
You must be connected to the internet to run this animation
Blood Pressure
• Blood Pressure is usually measured in the larger
conducting arteries where the high and low
pulsations of the heart can be detected – usually
the brachial artery.
– Systolic BP is the higher pressure measured during
left ventricular systole when the
aortic valve is open.
– Diastolic BP is the lower pressure
measured during left ventricular
diastole when the valve is closed.
Blood Pressure
• Normal BP varies by age, but is approximately 120 mm Hg
systolic over 80 mmHg diastolic in a healthy young adult ( in
females, the pressures are often 8–10 mm Hg less.)
• People who are in good physical condition or who have a
favorable genetic predisposition have lower BPs.
• It is often best to refer to the blood pressure as a single number,
called the mean arterial pressure (MAP) .
• MAP is roughly 1/3 of the way between the diastolic and
systolic BP. It is defined as 1/3 (systolic BP – diastolic BP) +
diastolic BP.
Blood Pressure
• In a person with a BP of 120/80 mm Hg, MAP = 1/3
(120-80) + 80 = 93.3 mm Hg.
• In the smaller arterioles,
capillaries, and veins,
the BP pulsations are not
detectable, and only a
mean BP is measurable
(see the purple and blue
areas of this figure).
Cardiac Cycle
• The cardiac cycle includes all events associated
with one heartbeat, including diastole
(relaxation phase) and systole (contraction
phase) of both the atria and the ventricles.
• In each cycle, atria and ventricles alternately
contract and relax.
• During atrial systole, the ventricles are relaxed.
• During ventricle systole, the atria are relaxed.
Cardiac Cycle
• Since ventricular function matters most to the body, the
two principal events of the cycle for us to understand are
ventricular filling (during ventricular diastole), and
ventricular ejection (during ventricular systole).
• The blood pressure that we measure in the arm is a reflection
of the pressure developed by the left ventricle, before and
after left ventricular systole.
• Pulmonary blood pressure is a result of right ventricular
function, but is not easily measured.
Cardiac Cycle
• The sequence of events in one cardiac cycle is
shown in Figure 20.14. Pay particular attention
to the left ventricle:
• 1st is atrial systole
• Followed by atrial diastole and ventricular systole
• Finally, ventricular diastole
Cardiac Cycle
Valves
AV
Ventricular
diastole
Ventricular
systole
Ventricular
diastole
SL Outflow
Atrial
Open
Closed
Open
Closed
Open
Closed
systole
Early atrial
diastole
Late atrial
diastole
Cardiac Cycle
• During the cardiac cycle, all 4 of the heart valves have a
chance to open and close. Listening (usually with a
stethoscope) to the sounds the heart makes is called
auscultation.
• Valve opening is usually
silent. The “lubb dupp”
we associate with
heart auscultation is
produced by valve closure (in pairs – see p. 740 left side).
Cardiac Cycle
Cardiac Cycle
• The average time required to complete the cardiac
cycle is usually less than one second (about 0.8
seconds at a heart rate of 75 beats/minute).
• 0.1 seconds – atria contract (atrial “kick”), ventricles are
relaxed
• 0.3 seconds – atria relax, ventricles contract
• 0.4 seconds – relaxation period for all chambers,
allowing passive filling. When heart rate increases, it’s
this relaxation period that decreases the most.
Cardiac Cycle
(Interactions Animation)
• Cardiac Cycle
You must be connected to the internet to run this animation
Cardiac Output
• The stroke volume (SV) is the volume of blood
ejected from the left (or right) ventricle every
beat. The cardiac output (CO) is the SV x heart
rate (HR).
• In a resting male, CO = 70mL/beat x 75 beats/min =
5.25L/min.
• On average, a person’s entire blood volume flows
through the pulmonary and systemic circuits each
minute.
Cardiac Output
• The cardiac reserve is the difference between the
CO at rest and the maximum CO the heart can
generate.
• Average cardiac reserve is 4-5 times resting value.
• Exercise draws upon the cardiac reserve to meet the body’s
increased physiological demands and maintain
homeostasis.
Cardiac Output
• The cardiac output is affected by changes in SV,
heart rate, or both.
• There are 3 important factors that affect SV (p.
741):
– The amount of ventricular filling before contraction
(called the preload)
– The contractility of the ventricle
– The resistance in the blood vessels (aorta) or valves
(aortic valve, when damaged) the heart is pumping
into (called the afterload)
Cardiac Output
• The more the heart muscle is stretched (filled)
before contraction (preload), the more forcefully
the heart will contract. This phenomenon is known
as Starling’s Law of the heart.
• Stimulation of the sympathetic
nervous system during
exercise increases venous
return, stretches the heart
muscle, and increases CO.
Cardiac Output
Cardiac Output
(Interactions Animation)
• Cardiac Output
You must be connected to the internet to run this animation
End of Chapter 20
Copyright 2012 John Wiley & Sons, Inc. All rights reserved.
Reproduction or translation of this work beyond that permitted in
section 117 of the 1976 United States Copyright Act without
express permission of the copyright owner is unlawful. Request for
further information should be addressed to the Permission
Department, John Wiley & Sons, Inc. The purchaser may make
back-up copies for his/her own use only and not for distribution or
resale. The Publisher assumes no responsibility for errors,
omissions, or damages caused by the use of these programs or
from the use of the information herein.

