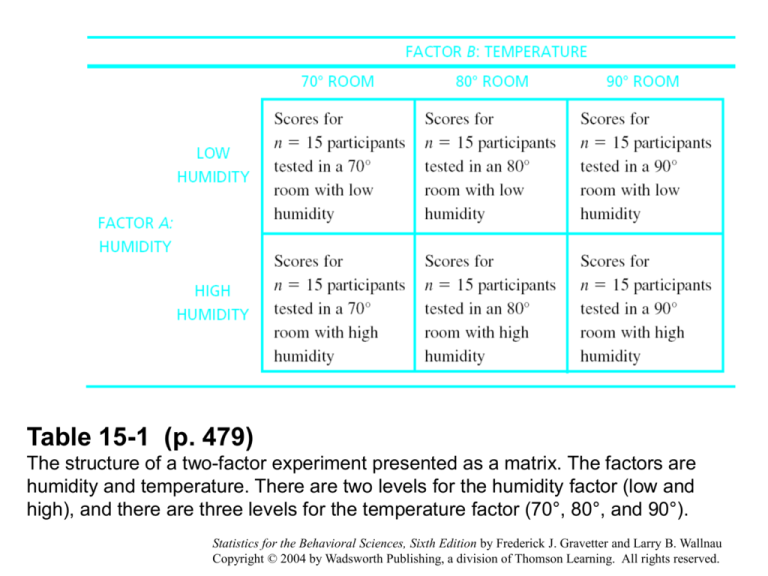
Table 15-1 (p. 479)
The structure of a two-factor experiment presented as a matrix. The factors are
humidity and temperature. There are two levels for the humidity factor (low and
high), and there are three levels for the temperature factor (70°, 80°, and 90°).
Statistics for the Behavioral Sciences, Sixth Edition by Frederick J. Gravetter and Larry B. Wallnau
Copyright © 2004 by Wadsworth Publishing, a division of Thomson Learning. All rights reserved.
Table 15-2 (p. 481)
Hypothetical data from an experiment examining two different levels of humidity
(factor A) and three different levels of temperature (factor B).
Statistics for the Behavioral Sciences, Sixth Edition by Frederick J. Gravetter and Larry B. Wallnau
Copyright © 2004 by Wadsworth Publishing, a division of Thomson Learning. All rights reserved.
Figure 15-4 (p. 482)
Hypothetical data from an experiment examining two different levels of humidity
(factor A) and three different temperature conditions (factor B). (These data show
the same main effects as the data in Table 15.2, but the individual treatment means
have been modified to produce an interaction.)
Statistics for the Behavioral Sciences, Sixth Edition by Frederick J. Gravetter and Larry B. Wallnau
Copyright © 2004 by Wadsworth Publishing, a division of Thomson Learning. All rights reserved.
Figure 15-2 (p. 484)
(a) Graph showing the data
from Table 15.2, where there
is no interaction. (b) Graph
showing the data from Table
15.3, where there is an
interaction.
Statistics for the Behavioral Sciences, Sixth Edition by Frederick J. Gravetter and Larry B. Wallnau
Copyright © 2004 by Wadsworth Publishing, a division of Thomson Learning. All rights reserved.
Figure 15-4a (p. 486)
Three sets of data showing different combinations of main effects and interaction for
a two-factor study. (The numerical value in each cell of the matrices represents the
mean value obtained for the sample in that treatment condition.)
Statistics for the Behavioral Sciences, Sixth Edition by Frederick J. Gravetter and Larry B. Wallnau
Copyright © 2004 by Wadsworth Publishing, a division of Thomson Learning. All rights reserved.
Figure 15-4b (p. 486)
Three sets of data showing different combinations of main effects and interaction for
a two-factor study. (The numerical value in each cell of the matrices represents the
mean value obtained for the sample in that treatment condition.)
Statistics for the Behavioral Sciences, Sixth Edition by Frederick J. Gravetter and Larry B. Wallnau
Copyright © 2004 by Wadsworth Publishing, a division of Thomson Learning. All rights reserved.
Figure 15-4c (p. 486)
Three sets of data showing different combinations of main effects and interaction for
a two-factor study. (The numerical value in each cell of the matrices represents the
mean value obtained for the sample in that treatment condition.)
Statistics for the Behavioral Sciences, Sixth Edition by Frederick J. Gravetter and Larry B. Wallnau
Copyright © 2004 by Wadsworth Publishing, a division of Thomson Learning. All rights reserved.
Figure 15-3 (p. 487)
(a) A line graph and (b) a bar
graph showing the results
from a two-factor experiment.
Statistics for the Behavioral Sciences, Sixth Edition by Frederick J. Gravetter and Larry B. Wallnau
Copyright © 2004 by Wadsworth Publishing, a division of Thomson Learning. All rights reserved.
Figure 15-4 (p. 489)
Structure of the analysis for a two-factor analysis of variance.
Statistics for the Behavioral Sciences, Sixth Edition by Frederick J. Gravetter and Larry B. Wallnau
Copyright © 2004 by Wadsworth Publishing, a division of Thomson Learning. All rights reserved.
Figure 15-5 (p. 490)
Hypothetical data for a two-factor research study comparing two levels of task
difficulty (easy and hard) and three levels of arousal (low, medium, and high). The
study involves a total of six different treatment conditions with n = 5 participants in
each condition.
Statistics for the Behavioral Sciences, Sixth Edition by Frederick J. Gravetter and Larry B. Wallnau
Copyright © 2004 by Wadsworth Publishing, a division of Thomson Learning. All rights reserved.
Table 15-6 (p. 496)
Results from an experiment examining the eating behavior of non-obese and obese
individuals who have either a full or an empty stomach.
Statistics for the Behavioral Sciences, Sixth Edition by Frederick J. Gravetter and Larry B. Wallnau
Copyright © 2004 by Wadsworth Publishing, a division of Thomson Learning. All rights reserved.
Table 1 (p. 500)
Statistics for the Behavioral Sciences, Sixth Edition by Frederick J. Gravetter and Larry B. Wallnau
Copyright © 2004 by Wadsworth Publishing, a division of Thomson Learning. All rights reserved.
Figure 15-5 (p. 501)
A table and a graph showing the mean number of crackers eaten for each of the
four groups in Example 15.2.
Statistics for the Behavioral Sciences, Sixth Edition by Frederick J. Gravetter and Larry B. Wallnau
Copyright © 2004 by Wadsworth Publishing, a division of Thomson Learning. All rights reserved.


