Chapter 12
advertisement

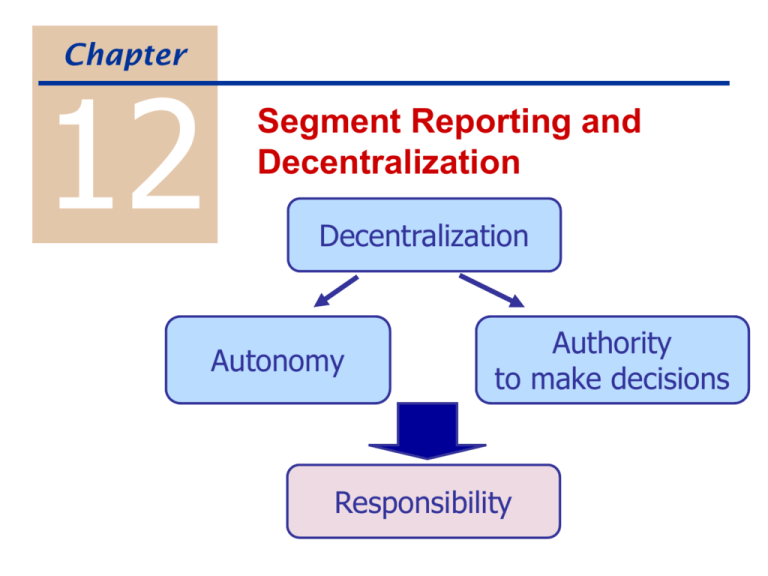
Chapter 12 Segment Reporting and Decentralization Decentralization Autonomy Authority to make decisions Responsibility Example of Decentralization Proctor & Gamble Fabric and Home Care Production Baby Care Food and Beverage Advantages? Disadvantages? Marketing Finance What management control system? Responsibility Centers Cost Center Profit center Investment center Segment Reporting Possible segments: divisions w/in a company product lines w/in a division Report by segment: revenues variable expenses Segment margin traceable fixed expenses Do not allocate common fixed expenses to segments. segment managers cannot control these Issues in Responsibility Accounting Responsibility for which expenses? Gain or loss on sale of equipment? Depreciation? Taxes? Does responsibility require complete control? Are comparisons meaningful across operating units? Should common costs ever be allocated? Evaluating Investment Center Performance Compagnie du Froid Required rate of return 18% Weighted-average cost of capital 15% Tax rate 30% Revenue Operating exp Net income Assets Current assets Plant & equip Accum deprec. Total assets Current liabilities France Italy Spain Fr 75,400 71,600 Fr 3,800 Fr 42,500 40,100 Fr 2,400 Fr 59,900 56,300 Fr 3,600 Fr 2,400 Fr 1,500 22,900 18,700 (7,300) (10,200) Fr 1,200 20,100 (5,300) Fr 18,000 Fr 10,000 Fr 16,000 Fr Fr Fr 4,200 1,100 800 = Return on Investment (ROI) Alternative Investment measures Oper. Income Total assets Total assets - current liab. Gross book value Income Investment France Italy Spain Fr 3,800 Fr 2,400 Fr 3,600 10,000 Fr 16,000 8,900 Fr 15,200 Fr 20,200 Fr 21,300 Fr 18,000 Fr Fr 13,800 Fr 25,300 Fr Residual Income = Income - (Required rate of return x Investment) Oper. Income Total assets ROI Residual income Fr France Italy Spain Fr 3,800 Fr 2,400 Fr 3,600 10,000 Fr 16,000 18,000 Fr Economic Value Added (EVA) After tax Income = Total - [ WACC x ( Assets France - Current )] Liabilities Italy Spain Oper. Income Total assets Fr 3,800 Fr 2,400 Fr 18,000 Fr 10,000 Fr 3,600 Fr 16,000 Total assets - current liab. Fr Fr 15,200 Residual income 3 Fr 560 13,800 ROI (assts-c_liab) 1 27.5% EVA Fr 8,900 2 Fr 600 1 Fr 720 2 27.0% 3 23.7% Transfer Prices The price one division charges to another for goods or services. Component Division Cellular Phone Division Micro-transmitter Pocket Cellular Objectives of transfer pricing system: Autonomy of the division managers. Decisions are in the best interest of the firm. Transfer price fairly represents each manager’s contribution to the firm. Ease of implementation. Transfer Pricing Example Component Division Other Compnts Pocket C $ 10.00 $ 8.00 $ 60.00 $ 50.00 2.00 1.50 22.00 26.00 Micro T Price DM / unit Cell Phone Division Other Phones 10.00 DL / unit CM / unit Units Total CM 4.00 3.00 13.00 8.00 $ 4.00 $ 3.50 $ 15.00 $ 16.00 500 4,500 500 3,000 $ 2,000 $15,750 $ 7,500 $48,000 A transfer price of $10.00. Other phones are higher margin for Cell Phone Division. If Cell Phone Division wants to renegotiate… Component Division Micro T Price Other Compnts $ 10.00 $ 8.00 DM / unit 2.00 1.50 DL / unit 4.00 3.00 $ 4.00 $ 3.50 500 4,500 $ 2,000 $15,750 CM / unit Units Total CM 1. Component Division has idle capacity. 2. Component Division is at full capacity. a. $10 mkt for Micro T b. No mkt for Micro T If Component Division wants to renegotiate… Cell Phone Division Pocket C Price DM / unit Other Phones $ 60.00 $ 50.00 22.00 26.00 1. Cell Phone Division has idle capacity. a. $10 mkt for Micro T b. No mkt for Micro T 10.00 DL / unit CM / unit Units Total CM 13.00 8.00 $ 15.00 $ 16.00 500 3,000 $ 7,500 $48,000 2. Cell Phone Division is at full capacity. When is a transfer in the best interest of the firm? Answer: When a price can be found that will satisfy both managers. If the transfer helps both divisions, it helps the firm as a whole. Notice that a transfer is not always in the firm’s best interest. 2. Component Division is at full capacity. b. No mkt for Micro T Minimum price = $9.50 2. Cell Phone Division is at full capacity. Maximum price = $9 Possible Transfer Prices Options Advantages Disadvantages Variable cost + opportunity cost ensures optimal decisions for the firm difficult to measure Market price a good price if a market exists markets often don’t exist or are imperfect Cost + mark-up easy to implement too high if supplying division has idle capacity no incentives to control costs; OH allocation games Negotiated by managers manager autonomy generally good decisions time-consuming


