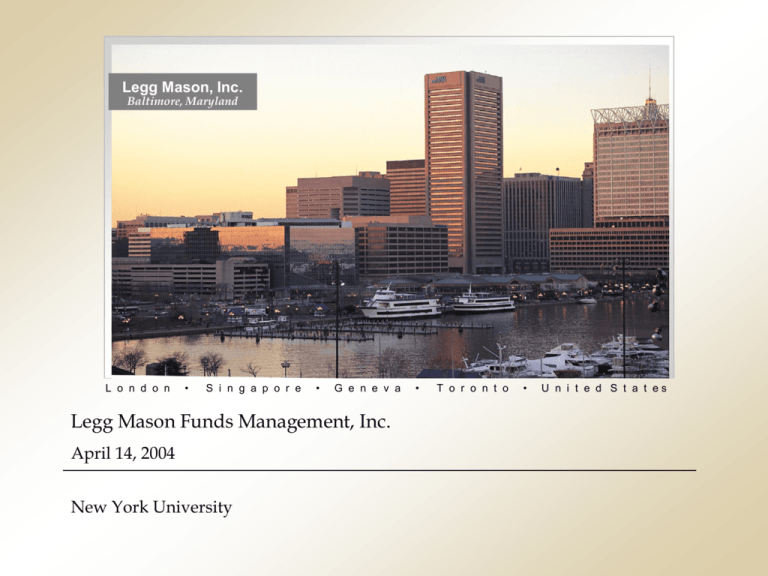
Legg Mason, Inc.
Baltimore, Maryland
L o n d o n
•
S i n g a p o r e
•
G e n e v a
Legg Mason Funds Management, Inc.
April 14, 2004
New York University
•
T o r o n t o
•
U n i t e d S t a t es
Legg Mason Funds Management Group
Total Assets:
$36.8bln
Total People:
59
Business Segments:
Retail
Institutional
Assets as of March 31, 2004
Source: Legg Mason Funds Management, Inc.
“Where is there an end of it, the soundless wailing…
Where is there an end to the drifting wreckage…
There is no end, but addition…
Years of living among the breakage
Of what was believed in as the most reliable…
We had the experience but missed the meaning…”
- T. S. Eliot
Source: T.S. Eliot, “The Dry Salvages”
Source: CALVIN AND HOBBES © 1995 Watterson. Used by permission of UNIVERSAL PRESS SYNDICATE.
All rights reserved.
“…beliefs are man-made…they are a conceptual
language we use to write down our observations
of nature…ideas become true in so far as they
help us get into satisfactory relation with other
parts of our experience…A belief is true and has
‘cash value’ if it helps us get from one place to
another. Truth becomes a ‘verb’, not a ‘noun’.”
- William James
“For a large class of cases – though not for all – in
which we employ the word ‘meaning’ it can be
defined thus: the meaning of a word is its use in the
language.”
- Ludwig Wittgenstein
Source: Ludwig Wittgenstein, “Philosophical Investigations”
The Market Is Efficient
% of Actively Managed Large Cap.
Funds that have Outperformed the
S&P 500 Index1,2
100%
80%
Very few Active
Large Capitalization
Managers outperform
the S&P 500
60%
40.3%
40%
27.7%
20.8%
20%
0%
13.8%
1 Yr
5 Yrs
10 Yrs
15 Yrs
Periods Ended 3/31/04
Source: Lipper Analytical Services
1 The
S&P 500 Index is considered to be an unmanaged index of common stock prices, which includes reinvestment of
dividends, and is generally considered representative of the U.S. stock markets.
2 This chart includes all Lipper Large Capitalization Mutual Funds (Growth, Core, Value) vs. the S&P 500 but excludes
Fund of Funds and Indexed Funds.
The Market is Efficient
Nifty Fifty Returns from Market Peak
December 1972 – June 1997
Annualized
Return (%)
1972 Actual
P/E Ratio
Warranted
P/E Ratio
EPS Growth (%) *
(through 1996)
Rebalanced Portfolio
12.7%
41.9
40.5
11.0%
Non-rebalanced Portfolio
12.4%
41.9
38.6
11.0%
S&P 500
12.9%
18.9
18.9
8.0%
* If a company had negative EPS in last year measured – used $0.01/share to calculate EPS growth.
Source: Jeremy J. Siegel, “Stocks for the Long Run”, copyrighted material, 2002
Problem: Forecasting Interest Rates
WSJ Survey of Economists
(Forecast: 30 Year Treasury)
6/82
12/82
6/83
12/83
6/84
12/84
6/85
12/85
6/86
12/86
6/87
12/87
6/88
12/88
6/89
12/89
6/90
12/90
6/91
12/91
6/92
12/92
6/93
Yield
Forecast
Levels
Actual
13.05%
13.27%
10.07%
10.54%
11.39%
13.78%
11.56%
10.50%
9.42%
7.41%
7.05%
8.45%
8.65%
8.98%
9.25%
8.12%
7.62%
8.16%
7.65%
8.22%
7.30%
7.61%
7.44%
13.92%
10.41%
10.98%
11.87%
13.64%
11.53%
10.44%
9.27%
7.28%
7.49%
8.50%
8.98%
8.85%
8.91%
8.04%
7.97%
8.40%
8.24%
8.41%
7.39%
7.78%
7.39%
6.67%
Source: Wall Street Journal, Revised 1/02/04
Forecast
Direction
Right
Wrong
Wrong
Wrong
Wrong
Wrong
Wrong
Wrong
Right
Wrong
Wrong
Right
Right
Wrong
Wrong
Wrong
Right
Wrong
Right
Wrong
Right
Wrong
12/93
6/94
12/94
6/95
12/95
6/96
12/96
6/97
12/97
6/98
12/98
6/99
12/99
6/00
12/00
6/01
12/01
6/02
6/02
12/02
06/03
12/03
06/04
Yield
Forecast
Levels
Actual
Forecast
Direction
6.84%
6.26%
7.30%
7.94%
6.60%
6.00%
6.86%
6.52%
6.79%
6.02%
5.72%
5.05%
5.83%
6.39%
6.01%
5.35%
5.30%
5.06%
6.34%
7.61%
7.87%
6.62%
5.94%
6.89%
6.64%
6.78%
5.92%
5.64%
5.09%
5.98%
6.48%
5.90%
5.50%
5.70%
5.02%
5.51%
4.80%**
3.82%**
3.51%**
4.25%**
Wrong
Wrong
Wrong
Wrong
Right
Right
Right
Wrong
Wrong
Wrong
Wrong
Wrong
Wrong
Right
Wrong
Wrong
Right
Right
5.20%**
4.42%**
3.85%
4.75%
Wrong
Wrong
Right
Observations: * Six month “Average” forecast of Economists
* Semi-Annual Survey by Wall Street
* Only 14 of 43 forecasts had direction correct
**Benchmark changed to 10 Year Treasury
“I have personally tried to invest money, my client’s
and my own, in every single anomaly and predictive
result that academics have dreamed up. And I have
yet to make a nickel on any of these supposed market
inefficiencies. An inefficiency ought to be an exploitable
opportunity. If there’s nothing investors can exploit in a
systematic way, time in and time out, then it’s very hard
to say that information is not being properly incorporated
into stock prices. Real money investment strategies don’t
produce the results that academic papers say they should.”
- Richard Roll
Source: Wall Street Journal, 12/28/00
How Does The S&P 500
Generate Its Returns?
Investment Strategy
Avoid macroeconomic
forecasting
Invest long term with low
turnover
Unconstrained by:
Volatility limitations
Sector, industry limitations
Investment style parameters
Performance pressures
Strategy
Favors sector or industry
leaders
Favors financially sound and
stable businesses
Requires adequate trading
liquidity
Portfolio Management Strategy
The Average Portfolio
Manager’s Mistakes
Tries to forecast macroeconomic
events
Trades too much
Owns too many stocks
Reacts to information
Oversimplifies valuation
Follows trends
Our Portfolio
Management Strategy
Avoid macroeconomic forecasting
Invest long-term with low
turnover
Construct focused portfolio
Let winners run, selectively weed
out losers
Value businesses, not stocks
Research intensively, using multivariate valuation approach
Don’t Believe Everything You Read
Fortune’s Year 2000 Guide to Retire Rich
July 19, 2000
7/19/00
Price
Total
Investment
12/31/03
Price
Value**
Broadcom
Charles Schwab
Enron
Genentech
Morgan Stanley
Nokia
Nortel Networks
Oracle
Univision
Viacom
$237
$36
$73
$150
$89
$54
$77
$74
$56.50*
$69
$10,000
$10,000
$10,000
$10,000
$10,000
$10,000
$10,000
$10,000
$10,000
$10,000
$34
$12
$0
$94
$58
$17
$4
$13
$40
$44
$1,435
$3,289
$0
$6,238
$6,502
$3,148
$549
$1,788
$7,025
$6,416
Total Investment
$100,000
$36,390
Percent Loss
(64%)
S&P 500 Percent Loss
(26%)
*Adjusted for 2 for 1 stock split, 7/28/2000
** Not including dividends.
Source: Fortune Magazine, August 14, 2000
The Common “Uncommon” Mistake
Investors Make
“Lehman Brothers 10 Uncommon Values® to Own for the Next 12 Months”
Stocks Placed on the List 6/30/99
Symbol
AOL
T
FSR
F
GIC
INTC
KLAC
LLY
MSFT
TYC
Name
AOL
AT&T
Firstar
Ford
General Instrument*
Intel
KLA Tencor
Eli Lilly
Microsoft
Tyco International
Subsequent 12
Month
Performance
Prior 12 Month
Performance
(6)%
(43)%
(20)%
(21)%
22%
113%
70%
35%
(12)%
(4)%
297%
50%
32%
-046%
59%
134%
12%
65%
47%
13%
7%
74%
21%
Average Performance
S&P 500
Performance Figures on Total Return Basis
*Acquired by MOT 1/5/00. Performance based on owning stock for entire 12 months.
The 10 Uncommon Values® were selected by Lehman Brothers' Investment Policy Committee; each stock was chosen because of its value
relative to the opportunity Lehman sees for the company 12 months from today. Every year the Investment Policy Committee reviews each
analyst's best idea to arrive at the list of 10 Uncommon Values®. This process has been a fixture at Lehman Brothers.
Source: Lehman Brothers, Bloomberg
The Common “Uncommon” Mistake
Investors Make
“Lehman Brothers 10 Uncommon Values® to Own for the Next 12 Months”
Stocks Placed on the List 6/30/00
Symbol
A
BEAS
CD
GMST
HWP
JNPR
LLY
MU
NT
TLAB
Name
Subsequent 12
Month
Performance
Prior 12 Month
Performance
Agilent Technologies
BEA Systems
Cendant
GemStar TV Guide
Hewlett-Packard
Juniper Networks Inc.
Eli Lilly and Company
Micron Technology Inc.
Nortel Networks
Tellabs Inc.
(56)%
(38)%
39%
(31)%
(54)%
(79)%
(25)%
(53)%
(87)%
(72)%
146%
653%
(32)%
88%
60%
498%
35%
308%
203%
-0-
Average Performance
S&P 500
(46%)
(15%)
196%
7%
Performance Figures on Total Return Basis
The 10 Uncommon Values® were selected by Lehman Brothers' Investment Policy Committee; each stock was chosen because of its value relative
to the opportunity Lehman sees for the company 12 months from today. Every year the Investment Policy Committee reviews each analyst's best
idea to arrive at the list of 10 Uncommon Values®. This process has been a fixture at Lehman Brothers.
Source: Lehman Brothers, Bloomberg
The Common “Uncommon” Mistake
Investors Make
“Lehman Brothers 10 Uncommon Values® to Own for the Next 12 Months”
Stocks Placed on the List 6/28/01
Symbol
AA
BBBY
CSCO
CMCSK
CE
HDI
LMG.A
MIR
WM
WMI
Name
Subsequent 12
Month
Performance
Prior 12 Month
Performance
Alcoa
Bed, Bath & Beyond
CISCO
Comcast Corp.
Concord EFS
Harley Davidson
AT&T Liberty Media Group
Mirant
Washington Mutual
Waste Management
(16%)
25%
(25%)
(44%)
7%
7%
(40%)
(79%)
1%
(15%)
37%
67%
(70%)
10%
113%
26%
(36%)
59%
89%
77%
Average Performance
S&P 500
(18%)
(18%)
37%
(14%)
Performance Figures on Total Return Basis
The 10 Uncommon Values® were selected by Lehman Brothers' Investment Policy Committee; each stock was chosen because of its value relative
to the opportunity Lehman sees for the company 12 months from today. Every year the Investment Policy Committee reviews each analyst's best
idea to arrive at the list of 10 Uncommon Values®. This process has been a fixture at Lehman Brothers.
Source: Lehman Brothers, Bloomberg
The Common “Uncommon” Mistake
Investors Make
“Lehman Brothers 10 Uncommon Values® to Own for the Next 12 Months”
Stocks Placed on List 6/26/02
Symbol
Name
Subsequent 12
Month
Performance
Prior 12 Month
Performance
AIG
APOL
BBBY
COF
HRC
KLAC
MCK
PFE
WEN
WY
American International Group, Inc.
Apollo Group, Inc.
Bed Bath & Beyond
Capital One Financial Corp.
HealthSouth Corp.
KLA-Yencor Corporation
McKesson Corporation
Pfizer, Inc.
Wendy’s International, Inc.
Weyerhaeuser Co.
(14)%
64%
7%
(13)%
(97)%
5%
7%
3%
(24)%
(14)%
(23)%
45%
23%
(6)%
(20)%
(24)%
(9)%
(16)%
54%
21%
Average Performance
S&P 500
(8)%
3%
5%
(19)%
Performance Figures on Total Return Basis
The 10 Uncommon Values® were selected by Lehman Brothers' Investment Policy Committee; each stock was chosen because of its value relative
to the opportunity Lehman sees for the company 12 months from today. Every year the Investment Policy Committee reviews each analyst's best
idea to arrive at the list of 10 Uncommon Values®. This process has been a fixture at Lehman Brothers.
Source: Lehman Brothers, Bloomberg
The Common “Uncommon” Mistake
Investors Make
“Lehman Brothers 10 Uncommon Values® to Own for the Next 12 Months”
Stocks Placed on List 6/24/03
Symbol
AMGN
BR
CSCO
EXC
HET
HPQ
JBLU
NXTL
TEVA
USB
Name
Amgen, Inc.
Burlington Resources Inc.
Cisco Systems, Inc.
Exelon Corp.
Harrah’s Entertainment, Inc.
Hewlett-Packard Co.
JetBlue Airways Corp.
Nextel Communications, Inc.
Teva Pharmaceuticals Industries Ltd - ADR
US Bancorp
Average Performance
S&P 500
Prior 12 Month
Performance
56%
38%
19%
18%
(11)%
35%
22%
374%
74%
12%
64%
3%
Performance Figures on Total Return Basis
The 10 Uncommon Values® were selected by Lehman Brothers' Investment Policy Committee; each stock was chosen because of its value relative
to the opportunity Lehman sees for the company 12 months from today. Every year the Investment Policy Committee reviews each analyst's best
idea to arrive at the list of 10 Uncommon Values®. This process has been a fixture at Lehman Brothers.
Source: Lehman Brothers, Bloomberg
Top 5 Performing Stocks For Each Decade –
In S&P 500
1970s
Rowan Companies, Inc
Scientific-Atlanta, Inc.
Schlumberger, Ltd
Pall Corp.
Baker-Hughes, Inc.
Return
Sector
1367%
1045%
1032%
919%
856%
Energy
Technology
Energy
Capital Goods
Energy
Return
Sector
8252%
6362%
5582%
4032%
3817%
Consumer Cyclicals
Consumer Cyclicals
Consumer Cyclicals
Consumer Cyclicals
Consumer Cyclicals
Return
Sector
88918%
80577%
20537%
16332%
14326%
Technology
Technology
Technology
Technology
Consumer Staples
1980s
Circuit City Stores, Inc.
Limited, Inc
Hasbro, Inc.
Wal-Mart Stores, Inc.
Dillards, Inc. – CL A
1990s
Dell Computer Corp.
EMC Corp.
Solectron Corp.
Tellabs, Inc.
Clear Channel Communications
Source: Factset, September 20, 2001
“I don’t buy options. Buying options is another way
to go to the poorhouse. Someone did a study for
the SEC and discovered that 90 percent of all
options expire as losses. Well, I figured out that
if 90 percent of all long option positions lost money,
that meant that 90 percent of all short option positions
make money. If I want to use options to be bearish,
I sell calls.”
- Jim Rogers
What Is the Bet?
Event
Probability
Outcome
Expectation
A
999/1000
$1
$.999
B
1/1000
($10,000)
($10.00)
Total
($9.001)
- Nassim Nicholas Taleb
Source: Nissam Nicholas Taleb, “Fooled by Randomness”, copyrighted material, 2001
Long Term Capital Management
vs. S&P
Gross Value of $1 Invested March 1994-October 1998
$5.00
$4.50
$4.00
$3.50
LTCM
$3.00
$2.50
$2.00
$1.50
$1.00
Source: Roger Lowenstien, “When Genius Failed”, copyrighted material, 2000
Sep-98
Jun-98
Mar-98
Dec-97
Sep-97
Jun-97
Mar-97
Dec-96
Sep-96
Jun-96
Dec-95
Sep-95
Jun-95
Mar-95
Dec-94
Sep-94
Jun-94
Mar-94
$0.00
Mar-96
S & P 500
$0.50
We Are Value Investors
What We Do:
We buy fractional ownership interests
in companies at large discounts to our
assessment of intrinsic business value.
We invest in them long term.
We Are Value Investors
What We Don’t Do:
Buy stocks based on price relationship
to pure accounting based metrics: P/E,
Price/Book, Price/Cash Flow.
Trade out of stocks when they reach
some predetermined level based on
those metrics.
Source: Money, June 2002. Copyright 2002. Used by permission. All rights reserved.
“When we think about the future of the world, we
always have in mind its being where it would be if it
continued to move as we see it moving now. We do
not realize that it moves not in a straight line…and
that its direction changes constantly.”
- Ludwig Wittgenstein
Source: Ludwig Wittgenstein, “Culture and Value”
10,000
Long Term Market Cycles
1,000
1,000
S&P 500
(Nominal)
100100
10
10
1926
1929
Annual
Total
Return 119.2%
P/E
Multiple
20x
1949
3.8%
14.7%
6x
Sources: DRI, Dow Jones, Value Line Publishing, Factset
6.8%
18x
2000
1982
1966
16.9%
8x
30x
S&P 500 Bear Markets: 1945-2002
Date of Top
Date of Bottom
Top
Bottom
Percent
Change
05/29/46
06/15/48
08/02/56
12/12/61
02/09/66
11/29/68
01/11/73
11/28/80
08/25/87
03/24/00
05/19/47
06/13/49
10/22/57
06/26/62
10/07/66
05/26/70
10/03/74
08/12/82
12/04/87
10/09/02
19.25
17.06
49.74
72.64
94.06
108.37
120.24
140.52
336.77
1,527.46
13.77
13.55
38.98
52.32
73.20
69.29
62.28
102.42
223.92
776.76
-28.47%
-20.57
-21.63
-27.97
-22.18
-36.06
-48.20
-27.11
-33.51
-49.15
355
363
446
196
240
543
630
622
101
929
-31.49%
444
Average
Source: Birinyi Associates, Inc.
Length
(Days)
“Bull markets are
born on pessimism,
grow on skepticism,
mature on optimism, and
die on euphoria.”
Sir John Templeton
Market Cycles
Starting a Bull Market
Ending a Bull Market
Profits Bottoming
Profits Peaking
Inflation Decelerating
Inflation Accelerating
Fed Cutting Interest Rates
Fed Raising Interest Rates
Stocks Undervalued
Stocks Overvalued
Longer-Term Returns Will be More Subdued.
Components of Equity Total Returns
8/82-3/00
1926-2002
Long-Term
Forecast 1
8.7%
7.3%
16.6%
5.2%
0.6%
5.8%
5.0%-7.0%
0.0%
5.0%-7.0%
Dividends & Reinvested
Dividends
3.2%
4.1%
1.6%
Total Return
20.3%
10.2%
6.6%-8.6%
Inflation
3.2%
3.1%
2.0%
Real Return
16.6%
6.9%
4.6%-6.6%
Capital Appreciation:
Earnings Driven
Valuation Driven
1
Forecasts are based on Bill Miller’s analysis – not indicative of future performance.
Sources: Ibbotson Assoc., Value Line, Sanford Bernstein, Jeremy Siegel, Legg Mason Funds Management, Inc.
Value Trust Top Ten Holdings
Percent of
Assets*
Nextel Communications, Inc.
Tyco International LTD
Amazon.com, Inc.
UnitedHealth Group Incorporated
InterActiveCorp.
MGIC Investment Corporation
Bank One Corporation
Washington Mutual, Inc.
J.P. Morgan Chase & Co.
Waste Management, Inc.
*As of March 31, 2004
Source: Legg Mason Funds Management, Inc.
7.7%
6.9%
6.7%
5.7%
5.1%
3.5%
3.4%
3.4%
3.3%
3.3%
Annualized Returns
Value Trust (net of fees)
S&P 500
60%
46.0%
35.1%
40%
20%
17.0% 14.1%
17.5%
11.7%
2.5%
0.7%
0%
0.6%
-1.2%
-20%
Since Inception*
4/16/82
10 Years
5 Years
3 Years
1 Year
As of March 31, 2004
Source: Legg Mason Funds Management, Inc., Lipper Analytical Services
*Prior to 1988 LMFM is not in compliance with AIMR-PPS standards due to the unavailability of records. It is shown as supplemental
information and reflects the performance of a single account.
The performance data quoted represents past performance and does not guarantee future results. Current performance may be lower or higher than
the performance data quoted. To obtain the most recent month-end information please visit www.leggmasonfunds.com. The investment return and
principal value of the fund will fluctuate so that an investor’s shares, when redeemed, may be worth more or less than the original cost.
Calculations assume reinvestment of dividends and capital gain distributions. For a free prospectus containing more complete information,
including the investment objectives, risks, charges, and expenses on any Legg Mason fund, call a Legg Mason Financial Advisor, call 1-800-5778589, or visit www.leggmasonfunds.com. Please consider all the information provided in the prospectus and read it carefully before investing.
Value Trust Performance
Relative to the S&P 500
20%
Value Trust outperformed the S&P 500
23 out of the last 40 quarters.
14.6%
15%
13.7%
10%
4.9%
5%
1.2%
10.1%
8.8%
9.0%
6.2%
5.7%
2.8%
1.8%
0.7%
0.6%
3.3%
4.9%
3.3%
2.8% 2.2%
1.9%
1.5%
0.2%
0%
-5%
-1.0%
-1.9%
-3.6%
-0.3%
-0.7%
-1.4% -0.9%
-1.7%
-1.7%
-3.5%
-2.3%
-2.9%
-3.9%
-5.4%
-6.5%
-10%
-7.6%
1993 1994
1.6%
0.9%
1995
1996
1997
1998
-33.8%
1999
2000
2001
2002
2003
As of March 31, 2004
Source: Legg Mason Funds Management, Inc., Lipper Analytical Services
*Prior to 1988 LMFM is not in compliance with AIMR-PPS standards due to the unavailability of records. It is shown as supplemental information and reflects
the performance of a single account.
The performance data quoted represents past performance and does not guarantee future results. Current performance may be lower or higher than the
performance data quoted. To obtain the most recent month-end information please visit www.leggmasonfunds.com. The investment return and principal value of
the fund will fluctuate so that an investor’s shares, when redeemed, may be worth more or less than the original cost. Calculations assume reinvestment of
dividends and capital gain distributions. For a free prospectus containing more complete information, including the investment objectives, risks, charges, and
expenses on any Legg Mason fund, call a Legg Mason Financial Advisor, call 1-800-577-8589, or visit www.leggmasonfunds.com. Please consider all the
information provided in the prospectus and read it carefully before investing.
Disclaimers
•
The S&P 500 is an unmanaged index of common stock prices that includes reinvestment of dividends and capital gain
distributions and is generally considered representative of the U.S. stock market.
•
The Lipper Large Cap Growth is an average of the 702 funds comprising the Lipper universe of large-cap growth funds,
defined as funds that invest at least 75% of their equity assets in companies with market capitalizations (on a three-year
weighted basis) greater than 300% of the dollar-weighted median market capitalization of the middle 1,000 securities of
the S&P SuperComposite 1500 Index. Large-cap growth funds typically have an above average price-to-earnings ratio,
price-to-book ratio, and three-year sales-per-share growth value, compared to the S&P 500 Index.
•
General Equity Funds in being defined as a fund index that includes all of the U.S. Domestic fund classifications as
defined by Lipper, Inc., which includes Large-Cap Growth Funds, Large-Cap Core Funds, Large-Cap Value Funds, MidCap Growth Funds, Mid-Cap Core Funds, Mid-Cap Value Funds, Small-Cap Growth Funds, Small-Cap Core Funds,
Small-Cap Value Funds, Multi-Cap Growth Funds, Multi-Cap Core Funds, Multi-Cap Value Funds, Equity Income Funds,
Specialty Diversified Equity Funds and the S&P 500 Funds.
•
Legg Mason Funds Management’s comments, opinions, and predictions about any particular security, the economy, and
“the market” are based on their own analysis and any forward predictions that may result from that analysis, are not
representative of actual future performance of any security, the economy, or “the market.”
•
Legg Mason Funds Management Group includes LMFM, Legg Mason Capital Management, Inc. (“LMCM”), and LMM,
LLC. LMFM, LMCM, and LMM LLC are registered investment advisers and wholly owned subsidiaries of Legg Mason,
Inc.
•
Past performance does not guarantee future results. The investment return and principal value of the fund will fluctuate
so that an investor’s shares, when redeemed, may be worth more or less than the original cost. Performance would have
been lower if fees had not been waived in various periods. Please refer to the fund’s most recent prospectus for complete
details.
•
Portfolio holdings are subject to change. Please see the most recent shareholder’s report for more information.
Legg Mason Wood Walker, Inc.
Member NYSE, Inc. - Member SIPC

