Presentation - Ministry of Forests, Lands and Natural Resource
advertisement
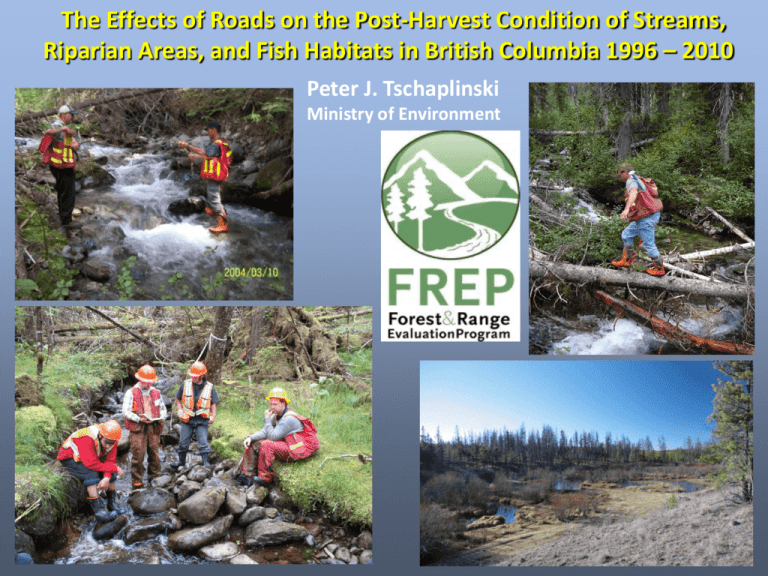
The Effects of Roads on the Post-Harvest Condition of Streams, Riparian Areas, and Fish Habitats in British Columbia 1996 – 2010 Peter J. Tschaplinski Ministry of Environment Riparian Management Evaluation Question Are riparian forestry and range practices effective in maintaining the structural integrity and functions of stream ecosystems and other aquatic resource features over both short and long terms? Stream-Riparian Indicators 1. Channel bed disturbance 2. Channel bank disturbance 3. LWD characteristics 9. Aquatic invertebrate diversity 10. Windthrow frequency 4. Channel morphology 11. Riparian soil disturbance/ bare ground 5. Aquatic connectivity 12. LWD supply/root network 6. Fish cover diversity 13. Shade & microclimate 7. Moss abundance & condition 14. Disturbance-increasers/ noxious weeds/invasive plants 8. Fine sediments 15. Vegetation form, vigour, & structure Evaluation Approach • Assess physical and biological conditions in streams and their riparian areas with RSM checklist covering 15 indicator-questions • Site assessments vary, based on stream morphology and fish use • 114–120 measurements, estimates, and observations are required to complete a stream-riparian assessment based on 38–60 specific indicators • Each main question answered “Yes = OK” or “No = problem” • Roll-up score = overall site condition Roll-up Scoring System Number of “No” Indicators out of 15: 1. Properly Functioning Condition 0 - 2 No’s 2. Properly Functioning, with Limited Impacts (= old “at Risk”) 3 - 4 No’s 3. Properly Functioning, with Impacts (intermediate = old “at High Risk”) 5 - 6 No’s 4. Not Properly Functioning > 6 No’s 2005-2011 Provincial Riparian-Stream Sample Harvest Years S1 S2 S3 S4 S5 S6 Total FP Code (1997-2003) 3 57 233 215 64 521 1093 Transition (2004-2006) 5 39 118 95 47 303 607 FRPA (2007-2010) 0 11 46 33 22 104 216 ALL 8 107 397 343 133 928 1916 Provincial RSM Summary of Post-harvest Stream-Riparian Condition Assessments, 2005 – 2011 800 Number of Streams 700 Sample = 1,916 722 600 563 500 400 393 300 238 200 100 0 38 % 29 % 21 % Properly Functioning Properly Functioning, Properly Functioning, Condition Limited Impacts with Impacts 12 % Not Properly Functioning Overall Stream/Riparian Condition by Stream Class, 2005 – 2011 1000 Province, 2005-2011 Survey Years (n = 1,916) 900 Properly Functioning Condition 800 Properly Functioning, Limited Impacts Properly Functioning, with Impacts Number of Streams 700 Not Properly Functioning 600 500 400 300 200 100 0 S1 S2 S3 S4 Stream Class S5 S6 Comparison of Post-Harvest Outcomes for BC Streams Pre-Code vs. Post 1995 Pre-Code Early FPC Era (FP Board audit) FREP 2005–2011 Riparian Class Percentage equivalent to FREP NPF Percentage equivalent to FREP NPF S1 5 0 0 S2 20 0.6 0.9 S3 41 4.4 5.0 S4 60 9.4 12.0 S5 45 3.3 7.5 S6 76 20.2 17.9 Percentage NPF Trends in Post-Harvest Outcomes for BC Streams: FP Code, Transition, and FRPA Eras FREP Monitoring by HARVEST ERA FP Code Era 1997–2003 Transition Era 2004–2006 FRPA Era 2007–2010 Riparian Class n = 841 n = 607 n = 216 Percentage NPF Percentage NPF Percentage NPF S1 0 0 0 S2 2.0 0 0 S3 6.1 5.9 2.2 S4 9.9 12.6 15.2 S5 7.3 4.2 18.1 S6 17.9 16.5 18.3 Overall Results by Main Indicator-Question Percentage of Streams 0% 20% 40% 60% 80% 100% Channel bed disturbance (Q1) Channel bank disturbance (Q2) Channel LWD characteristics (Q3) Channel morphology (Q4) Aquatic connectivity (Q5) Fish cover diversity (Q6) Moss abundance & condition (Q7) Fine sediments (Q8) Aquatic invertebrate diversity (Q9) Windthrow frequency (Q10) Riparian soil disturbance/bare ground (Q11) LWD supply/root network (Q12) Shade and microclimate (Q13) Disturbance-increaser plants (Q14) Vegetation form, vigour & structure (Q15) Yes = Not affected No = Affected (non-forestry-related causes) No = Affected (forestry-related impacts) NA Overall Sources of Impact for Affected Streams Coast Area Northern Interior Area Southern Interior Area ALL 81 62 65 68 Low RMA Tree Retention 59 43 44 48 Windthrow 23 33 38 32 Falling and Yarding 53 20 23 30 Fire, Beetle Infestation 17 30 40 30 Machine disturbance: Harvesting 20 23 34 26 <1 3 24 9 Major Impact Factor Roads (sediment generation and transport) (includes logging in-stream slash) (non-forestry related) Livestock Trampling Sediment from Road Surfaces and Ditches 600 Number of streams Affected 500 Not affected Frequency of Observed Impacts from Road-Related Sources 400 300 200 100 0 S1 S2 S3 S4 S5 S6 Stream Class Perched or Blocked Culvert 600 Road Crossing Leaks Fines into Stream 500 600 Not affected Affected Number of streams Number of streams Affected 400 300 200 100 500 Not affected 400 300 200 100 0 S1 S2 S3 S4 Stream Class S5 S6 0 S1 S2 S3 S4 Stream Class S5 S6 Frequency of Observed Impacts on Sediment/Debris from Non-Road Sources Windthrow Machine Disturbance in RMA During Harvest 600 600 Affected 500 Number of streams Number of streams Affected Not affected 400 300 200 100 500 Not affected 400 300 200 100 0 0 S1 S2 S3 S4 S5 S1 S6 S2 S3 S4 S5 S6 Stream Class Stream Class Hillslope Failure Trampling (livestock, wildlife) 600 600 Affected Affected Number of streams Number of streams 500 Not affected 400 300 200 100 0 500 Not affected 400 300 200 100 0 S1 S2 S3 S4 Stream Class S5 S6 S1 S2 S3 S4 Stream Class S5 S6 Province-wide Riparian Retention Levels by Stream Class Buffer Width (m) = Mean Distance from Streambank to Beginning of Tree Harvest (Harvest Edge) Percentage Stream of Streams Class Buffered Mean Standard Error Sample (n) S1 100 67 16.9 5 S2 100 42 2.5 72 S3 100 32 1.4 211 S4 78 17 1.4 179 S5 84 28 4.5 76 S6 56 11 1.0 516 ALL 74 20 0.8 1,059 Functional Outcomes for Streams with Full Retention vs. Understory/Small Vegetation Within First 10 m of the RMA Percent of Streams Fish Bearing with Riparian Reserves (Class S1, S2, S3) Classes S4, S5, & S6 with Overstory and Understory Retention Classes S4, S5, & S6 with Mainly Understory Retention PFC 51 52 22 PFC-L 31 29 30 PFC-I 13 14 28 NPF 5 5 20 Functioning Condition Key Factors Affecting Management Outcomes for Stream-Riparian Systems 1. Amount of road-related sediment found at stream crossings (all stream classes) • Management of fine sediments remains a concern in spite of improvements • 83 % of non-fish-bearing class S6 headwater streams were affected by fine sediments in the FP Code harvest years (1997 – 2003) • This has decreased to 60 % of class S6s during the FRPA years 2. Levels of riparian tree retention for many small streams (classes S4, S5, S6) • Functional outcomes or “health” of small streams with buffers 10 m wide are equivalent to larger fish-bearing streams with riparian reserves 20 - 50 m wide • Nearly 20 % of class S4s and 45% of S6s are without treed buffers ADM Recommendations for Improved Practices Outcomes 1. Establish full wind-firm buffers 10 m wide on all class S4 fish-bearing streams and PERENNIAL non-fish-bearing class S5s and S6s that deliver water, alluvial sediments, nutrients, organic materials, and invertebrates to fish-bearing habitats and (or) drinking water sources • Can be achieved without increasing overall retention levels in a landscape by redistributing current levels of riparian retention for small streams to priority reaches 2. Retain, at minimum, all non-merchantable trees, understory trees, smaller vegetation and as many wind-firm trees as possible within the first 10 m of the RMA for all other S5s and S6s (e.g., INTERMITTENT and EPHEMERAL streams with low transport capability) directly connected to fish-bearing areas and (or) drinking water sources 3. Limit fine sediments input from road crossings and riparian practices • Follow well-established best management practices concerning fine sediment delivery to streams and stream crossings. • Forest Road Engineering Guidebook; Erosion and Sediment Control Practices for Forest Roads and Stream Crossings; and the Fish-stream Crossing Guidebook, Revised Edition, September 2012
