a + b
advertisement
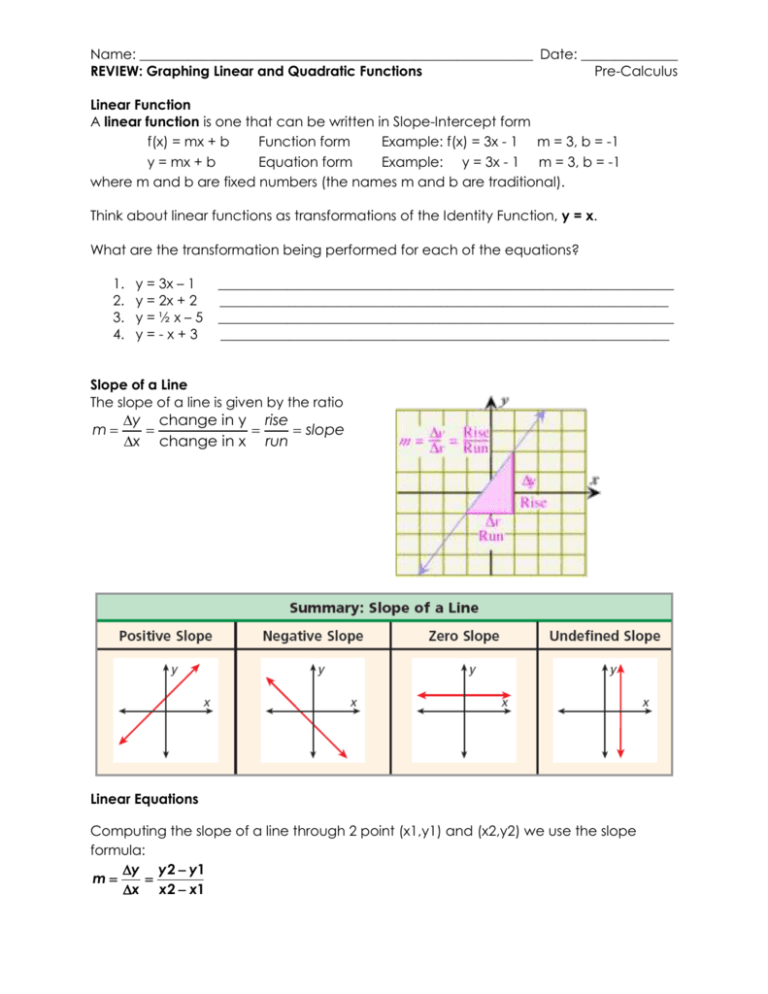
Name: _________________________________________________________ Date: ______________ REVIEW: Graphing Linear and Quadratic Functions Pre-Calculus Linear Function A linear function is one that can be written in Slope-Intercept form f(x) = mx + b Function form Example: f(x) = 3x - 1 m = 3, b = -1 y = mx + b Equation form Example: y = 3x - 1 m = 3, b = -1 where m and b are fixed numbers (the names m and b are traditional). Think about linear functions as transformations of the Identity Function, y = x. What are the transformation being performed for each of the equations? 1. 2. 3. 4. y = 3x – 1 y = 2x + 2 y=½x–5 y=-x+3 __________________________________________________________________ _________________________________________________________________ __________________________________________________________________ _________________________________________________________________ Slope of a Line The slope of a line is given by the ratio m y change in y rise slope x change in x run Linear Equations Computing the slope of a line through 2 point (x1,y1) and (x2,y2) we use the slope formula: y y 2 y1 m x x2 x1 Example: Find the slope of the line through (1, 3) and (5, 11) y y 2 y1 11 3 8 m 2 x x2 x1 5 1 4 Your turn: 5. Find the slope of the line through (-1, 0) and (2, -2) ___________________ Finding the Equation of a Line Problem: Find the equation of the line that passes through the point (-2, 5) and has a slope of -4. Solution: Substitute y1 , x1 and m in the point slope form of a line y - y1 = m(x - x1) y - 5 = - 4(x - (-2)) y = - 4x - 3 Your Turn: 6. Find the equation of the line that passes through the point (3 , 0) and has a slope of – 1. Problem: Find the equation of the line that passes through the points (0 , -1) and (3 , 5). Solution: We first calculate the slope of the line m = (5 - (-1)) / (3 - 0) = 6 / 3 = 2 Use the slope and any of the two points to write the equation of the line using the point slope form. y - y1 = m(x - x1) using the first point y - (-1) = 2(x - 0) y = 2x - 1 Your Turn: 7. Find the equation of the line that passes through the points (2 , 0) and (3 , 3). Quadratic Functions A quadratic function of the variable x is a function that can be written in the form f(x) = ax2 + bx + c Function form y = ax2 + bx + c Standard form (an equation) where a, b, and c are fixed numbers (with a ≠ 0). Examples 1. f(x) = 3x2 - 2x + 1 2. g(x) = -x2 3. h(x) = 3x + 1 a = 3, b = -2, c = 1 a = -1, b = 0, c = 0 Not a quadratic function because a = 0 (it’s a linear function) Factoring Quadratics Flowchart GCF Greatest Common Factor Binomials Trinomials 2 Perfect Squares Difference of 2 Squares Factor it Un-FOIL-ing a2 – b2 = (a + b)(a – b) Factor it Box Method Factor it Quadratic Formula x b b 2 4 ac 2a Features of a Parabola A parabola in standard form f(x) = ax2 + bx + c (a ≠ 0) has the following features: 1) Concavity – does it open up or down 2) The axis of symmetry (the line of symmetry for the parabola) 3) The vertex (the minimum or maximum point of the parabola) 4) The y-intercept (where it crosses the y-axis) 5) The x-intercepts (where it crosses the x-axis) To Graph a Quadratic Function To graph a quadratic function, you must find each of the features listed above. EXAMPLE: Graph the function f(x) = x2 - 5x + 6 1. Concavity If a > 0, the parabola is concave up [opens up]; if a < 0, the parabola is concave down [opens down]. Example For f(x) = x2 - 5x + 6 has a = 1 < 0, so the graph is concave up (opens up) 2. Axis of Symmetry A vertical line with the equation x x= -b -(-5) 5 = = 2.5 2a 2(1) 2 b 2a 3. Vertex b (same as the axis of 2a b symmetry, which was found in #2 above). The y-coordinate is f( ). 2a A point, (x, y). The x-coordinate of the vertex is Example The graph of f(x) = -3x2 - 6x - 3 has vertex with the following coordinates: x-coordinate= -b =2.5 2a b 2 y coordinate f(x) f f(2.5) (2.5) 5(2.5) 6 .25 2 a The vertex is (-1, -3) y-Intercept - where the graph crosses the y-axis. Find it by setting x = 0. The y-intercept is given by y = c. Example The graph of f(x) = -3x2 - 6x - 3 has c = -3, so the y-intercept is given by y = -3. x-Intercepts - where the graph crosses the x-axis. Find it by setting y = 0. The x-intercepts, if they exist, are given by setting f(x) or y equal to zero: ax2 + bx + c = 0 and solving for x. To do this, you will need to factor the (see flow chart above). Note: If the quadratic has no real factors (i.e. the square-root yields imaginary numbers) then there are no x-intercepts -- the parabola is entirely above or below the x-axis. Example Find the x-intercepts of f(x) = x2 - 5x + 6 by solving the quadratic x2 - 5x + 6 = 0 step 1: set f(x) = 0 To solve for x, factor the quadratic: x2 - 5x + 6 = 0 (x - 3)(x - 2) = 0 x–3=0 x–2=0 x=3 x=2 The x-intercepts are 3 and 2. These are where the graph crosses the x-axis. These are the points (3, 0) and (2, 0). To Graph a Quadratic Function: Draw a faint dotted line for the axis of symmetry (it is a vertical line). Place dots on the grid for the vertex (should lie on the axis of symmetry), and the x- and y-intercepts. If possible, use symmetry to find matching points. Find other points with a T-table if necessary (you should have 5 points at a minimum). Connect the dots with a smooth graph. Put arrow heads on the ends.
