Soybean Plant Needs: Lesson Plan for Agricultural Science
advertisement
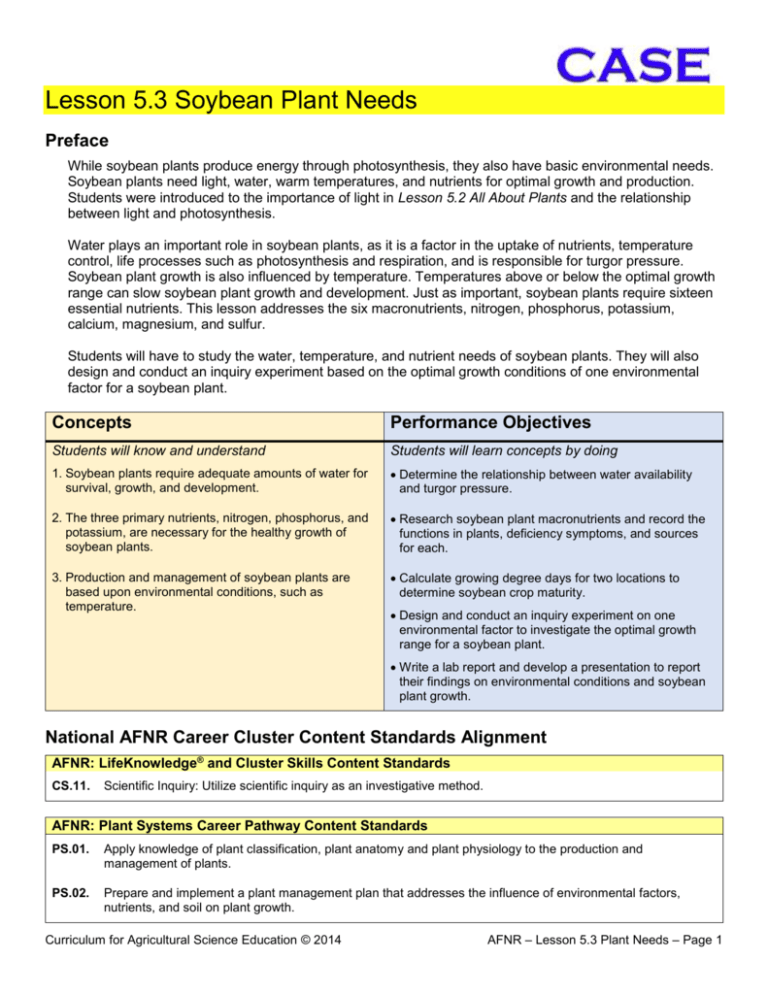
Lesson 5.3 Soybean Plant Needs Preface While soybean plants produce energy through photosynthesis, they also have basic environmental needs. Soybean plants need light, water, warm temperatures, and nutrients for optimal growth and production. Students were introduced to the importance of light in Lesson 5.2 All About Plants and the relationship between light and photosynthesis. Water plays an important role in soybean plants, as it is a factor in the uptake of nutrients, temperature control, life processes such as photosynthesis and respiration, and is responsible for turgor pressure. Soybean plant growth is also influenced by temperature. Temperatures above or below the optimal growth range can slow soybean plant growth and development. Just as important, soybean plants require sixteen essential nutrients. This lesson addresses the six macronutrients, nitrogen, phosphorus, potassium, calcium, magnesium, and sulfur. Students will have to study the water, temperature, and nutrient needs of soybean plants. They will also design and conduct an inquiry experiment based on the optimal growth conditions of one environmental factor for a soybean plant. Concepts Performance Objectives Students will know and understand Students will learn concepts by doing 1. Soybean plants require adequate amounts of water for survival, growth, and development. Determine the relationship between water availability and turgor pressure. 2. The three primary nutrients, nitrogen, phosphorus, and potassium, are necessary for the healthy growth of soybean plants. Research soybean plant macronutrients and record the functions in plants, deficiency symptoms, and sources for each. 3. Production and management of soybean plants are based upon environmental conditions, such as temperature. Calculate growing degree days for two locations to determine soybean crop maturity. Design and conduct an inquiry experiment on one environmental factor to investigate the optimal growth range for a soybean plant. Write a lab report and develop a presentation to report their findings on environmental conditions and soybean plant growth. National AFNR Career Cluster Content Standards Alignment AFNR: LifeKnowledge® and Cluster Skills Content Standards CS.11. Scientific Inquiry: Utilize scientific inquiry as an investigative method. AFNR: Plant Systems Career Pathway Content Standards PS.01. Apply knowledge of plant classification, plant anatomy and plant physiology to the production and management of plants. PS.02. Prepare and implement a plant management plan that addresses the influence of environmental factors, nutrients, and soil on plant growth. Curriculum for Agricultural Science Education © 2014 AFNR – Lesson 5.3 Plant Needs – Page 1 Next Generation Science Standards Alignment Science and Engineering Practices Asking Questions and Defining Problems Asking questions and defining problems in 9–12 builds on K–8 experiences and progresses to formulating, refining, and evaluating empirically testable questions and design problems using models and simulations. Ask questions that arise from careful observation of phenomena, or unexpected results ▪ to clarify and/or seek additional information. ▪ to determine relationships, including quantitative relationships, between independent and dependent variables. Ask questions that can be investigated within the scope of the school laboratory, research facilities, or field (e.g., outdoor environment) with available resources and, when appropriate, frame a hypothesis based on a model or theory. Planning and Carrying Out Investigations Planning and carrying out investigations in 9-12 builds on K-8 experiences and progresses to include investigations that provide evidence for and test conceptual, mathematical, physical, and empirical models. Plan an investigation or test a design individually and collaboratively to produce data to serve as the basis for evidence as part of building and revising models, supporting explanations for phenomena, or testing solutions to problems. Consider possible confounding variables or effects and evaluate the investigation’s design to ensure variables are controlled. Select appropriate tools to collect, record, analyze, and evaluate data. Analyzing and Interpreting Data Constructing Explanations and Designing Solutions Engaging in Argument from Evidence Obtaining, Evaluating, and Communicating Information Make directional hypotheses that specify what happens to a dependent variable when an independent variable is manipulated. Analyzing data in 9–12 builds on K–8 experiences and progresses to introducing more detailed statistical analysis, the comparison of data sets for consistency, and the use of models to generate and analyze data. Analyze data using tools, technologies, and/or models (e.g., computational, mathematical) in order to make valid and reliable scientific claims or determine an optimal design solution. Consider limitations of data analysis (e.g., measurement error, sample selection) when analyzing and interpreting data. Constructing explanations and designing solutions in 9–12 builds on K– 8 experiences and progresses to explanations and designs that are supported by multiple and independent student-generated sources of evidence consistent with scientific ideas, principles, and theories. Make a quantitative and/or qualitative claim regarding the relationship between dependent and independent variables. Engaging in argument from evidence in 9–12 builds on K–8 experiences and progresses to using appropriate and sufficient evidence and scientific reasoning to defend and critique claims and explanations about the natural and designed world(s). Arguments may also come from current scientific or historical episodes in science. Construct, use, and/or present an oral and written argument or counter-arguments based on data and evidence. Obtaining, evaluating, and communicating information in 9–12 builds on K–8 experiences and progresses to evaluating the validity and reliability of the claims, methods, and designs. Communicate scientific and/or technical information or ideas (e.g. about phenomena and/or the process of development and the design and performance of a proposed process or system) in multiple formats (including orally, graphically, textually, and mathematically). Crosscutting Concepts Cause and Effect: Mechanism and Prediction Events have causes, sometimes simple, sometimes multifaceted. Deciphering causal relationships, and the mechanisms by which they are mediated, is a major activity of science and engineering. Cause and effect relationships can be suggested and predicted for complex natural and human designed systems by examining what is known about smaller scale mechanisms within the system. Systems can be designed to cause a desired effect. Understandings about the Nature of Science Curriculum for Agricultural Science Education © 2014 AFNR – Lesson 5.3 Plant Needs – Page 2 Scientific Science investigations use diverse methods and do not always use the same set of procedures to obtain Investigations Use a data. Variety of Methods Scientific inquiry is characterized by a common set of values that include: logical thinking, precision, openmindedness, objectivity, skepticism, replicability of results, and honest and ethical reporting of findings. Science is a Way of Science is both a body of knowledge that represents a current understanding of natural systems and the Knowing processes used to refine, elaborate, revise, and extend this knowledge. Common Core State Standards for High School Mathematics Modeling standards are indicated by the star symbol (*) throughout other conceptual categories. CCSS: Conceptual Category – Number and Quantity Quantities *Reason quantitatively and use units to solve problems. CCSS: Conceptual Category – Statistics and Probability Interpreting Categorical and Quantitative Data Making Inferences and Justifying Conclusions *Summarize, represent, and interpret data on a single count or measurement variable. *Make inferences and justify conclusions from sample surveys, experiments, and observational studies. Common Core State Standards for English Language Arts CCSS: English Language Arts Standards » Science & Technical Subjects » Grade 9-10 RST.9-10.3 – Follow precisely a complex multistep procedure when carrying out experiments, Key Ideas and Details taking measurements, or performing technical tasks, attending to special cases or exceptions defined in the text. RST.9-10.7 – Translate quantitative or technical information expressed in words in a text into visual form (e.g., a table or chart) and translate information expressed visually or mathematically (e.g., in an equation) into words. Integration of Knowledge and Ideas CCSS: English Language Arts Standards » Writing » Grade 9-10 Text Types and Purposes Production and Distribution of Writing Research to Build and Present Knowledge Range of Writing WHST.9-10.2 – Write informative/explanatory texts, including the narration of historical events, scientific procedures/ experiments, or technical processes. WHST.9-10.2.A – Introduce a topic and organize ideas, concepts, and information to make important connections and distinctions; include formatting (e.g., headings), graphics (e.g., figures, tables), and multimedia when useful to aiding comprehension. WHST.9-10.2.F – Provide a concluding statement or section that follows from and supports the information or explanation presented (e.g., articulating implications or the significance of the topic). WHST.9-10.4 – Produce clear and coherent writing in which the development, organization, and style are appropriate to task, purpose, and audience. WHST.9-10.6 – Use technology, including the Internet, to produce, publish, and update individual or shared writing products, taking advantage of technology's capacity to link to other information and to display information flexibly and dynamically. WHST.9-10.7 – Conduct short as well as more sustained research projects to answer a question (including a self-generated question) or solve a problem; narrow or broaden the inquiry when appropriate; synthesize multiple sources on the subject, demonstrating understanding of the subject under investigation. WHST.9-10.10 – Write routinely over extended time frames (time for reflection and revision) and shorter time frames (a single sitting or a day or two) for a range of discipline-specific tasks, purposes, and audiences. Essential Questions 1. What are the environmental needs of soybean plants? 2. What roles does water play in sustaining soybean plant life? 3. How does water help physically support soybean plants? 4. How does temperature affect soybean plant growth and maturity? 5. How can the maturity of soybean plants be predicted using historical climate data? Curriculum for Agricultural Science Education © 2014 AFNR – Lesson 5.3 Plant Needs – Page 3 6. Why are nutrients necessary for soybean plants? 7. What are the essential macronutrients? 8. How are nutrient deficiency symptoms identified? 9. What are the optimal ranges of environmental conditions for soybean plant growth? Key Terms Absorb Accumulation Deficiency Essential nutrient Growing degree day Growth Herbaceous Macronutrient Micronutrient Nutrient Permanent wilting point Threshold Turgor Turgor pressure Wilt Day-to-Day Plans Time: 7 days The teacher will refer to the Teacher Resources section for specific information on teaching this lesson, in particular Lesson 5.3 Teacher Notes, Lesson 5.3 Glossary, Lesson 5.3 Materials, and other support documents. Day 1: The teacher will present Concepts, Performance Objectives, Essential Questions, and Key Terms in order to provide a lesson overview. The teacher will provide students with a copy of Activity 5.3.1 Soybeans Standing Tall with Water. Students will work in teams of three to complete Step 1-12 of Activity 5.3.1 Soybeans Standing Tall with Water. Day 2: Students will complete the remainder of Activity 5.3.1 Standing Tall with Water and the Conclusion questions. The teacher will provide students with a copy of Activity 5.3.2 Soybeans Grown in the Sun. Students will work individually to complete Activity 5.3.2 Soybeans Grown in the Sun. The teacher will review how growing degree-days influence plants and crops. The teacher will provide students with a copy of Activity 5.3.3 Digging Up Soybean Nutrients. Students will work individually to complete Activity 5.3.3 Digging Up Soybean Nutrients. Day 3: Day 4 – 6: The teacher will provide students with a copy of Project 5.3.4 Soybean Optimal Growth Ranges and discuss designing inquiry experiments with students. Students will work in teams of three to design an experiment for Project 5.3.4 Soybean Optimal Growth Ranges. The teacher will review and approve the prediction, materials, procedures, and data collection instrument for each team of students. Students will conduct their experiments and collect data. NOTE: Data collection times will differ based on experiment design. Lab reports and presentations should be submitted and assessed based on the needs of each team. The teacher will assess student work using the Lab Report Rubric and Project 5.3.4 Presentation Rubric upon project completion. Curriculum for Agricultural Science Education © 2014 AFNR – Lesson 5.3 Plant Needs – Page 4 Day 7: The teacher will lead students in a summary discussion of the activities and project to verify students understand concepts of the lesson. The teacher will distribute Lesson 5.3 Check for Understanding. Students will complete Lesson 5.3 Check for Understanding and submit for grading. The teacher will use Lesson 5.3 Check for Understanding Answer Key to grade student assessments. Instructional Resources Student Support Documents Activity 5.3.1 Soybeans Standing Tall with Water Activity 5.3.2 Soybeans Grown in the Sun Activity 5.3.3 Digging Up Soybean Nutrients Project 5.3.4 Soybean Optimal Growth Ranges Lesson 5.3 Glossary Teacher Resources Lesson 5.3 Teacher Notes Lesson 5.3 Check for Understanding Lesson 5.3 Materials Answer Keys and Assessment Rubrics Activity 5.3.2 Answer Key Project 5.3.4 Presentation Rubric Lab Report Rubric Lesson 5.3 Check for Understanding Answer Key Student Project Development Template Lab Report Template Reference Sources Burton, L.D. (2010). Agriscience: fundamentals and applications (5th ed.). Clifton Park, NY: Delmar. Herren, R. V., & Donahue, R. L. (2000). Delmar’s agriscience dictionary with searchable CD-ROM. Albany, NY: Delmar. National Climatic Data Center. (2010). U.S. Climate Normals. Retrieved January 2010 from http://hurricane.ncdc.noaa.gov/cgi-bin/climatenormals/climatenormals.pl Parker, R. (2010). Plant and soil science: Fundamentals and applications. Clifton Park, NY: Delmar. This lesson will provide conceptual and procedural knowledge required for participation in the following FFA activities: Agricultural Proficiency Agriscience Fair National Agronomy Career Development Event Curriculum for Agricultural Science Education © 2014 AFNR – Activity 5.3.2 Grown in the Sun – Page 5 National Floriculture Career Development Event National Nursery/Landscape Career Development Event For more on the National FFA Organization review the following URL: http://www.ffa.org/. Cultivating plants offers countless opportunities for SAE projects in the fields of crop production, horticulture, nursery production, and hydroponics. Below are some examples of SAE activities connected to this lesson of study: Develop a fertilizer plan for homeowners addressing proper lawn care. Work for a local nursery watering crops and monitoring plant health. Determine a planting schedule for vegetable crops in the local area to reach maturity at varied intervals. Work for a local crop producer assisting with irrigation, fertilization, and harvest. For more information regarding opportunities related to Supervised Agricultural Experience, view the webpage at the following URL: http://www.ffa.org/index.cfm?method=c_programs.SAE. Critical Thinking and Application Extensions Explanation 1. Students will create a poster exhibiting the primary macronutrients and their deficiency symptoms to be displayed in the greenhouse to assist with nutrient monitoring. Application 2. Students will develop a spreadsheet that calculates the growing degree days for their hometown and determine when common vegetable crops should mature. Perspective 3. Students will research and write a report comparing the types of crops produced in temperate versus tropical areas and how those crops influence native diets. Curriculum for Agricultural Science Education © 2014 AFNR – Activity 5.3.2 Grown in the Sun – Page 6 Activity 5.3.1 Soybeans Stand Tall with Water Purpose Water is essential to all living plants and cells. It is especially important to plant growth and production. Plants absorb most water through their roots. What happens to plants when there is not enough water? In herbaceous, or non-woody, plants, turgor pressure holds plants upright. Turgor pressure is the force that water inside the vacuole of a cell exerts on the cell wall. When the vacuole is full and pushing against the cell wall, plants stand tall and upright. With insufficient water, plants lose turgor pressure and wilt. When water is deficient for too long plants reach their permanent wilting point, or the point when they can no longer recover from a water deficiency. Materials Per team of three students: Per student: Electric fan 3 soybean plants 2 rock wool cubes 30 ml graduated cup Ruler Water Computer with Internet access Agriscience Library Pencil Agriscience Notebook Procedure You and your teammates will be determining the necessity of water on soybean plant survival and growth. By using a fan to aid in the flow of air around your soybeans, evaporation is increased to allow you to make observations more quickly. 4. Obtain three soybean plants from your teacher. 5. Remove all media from their roots and rinse with water. 6. Place the roots of two of the soybean plants in the rock wool cubes. 7. Place 20 ml of water in the graduated cup. 8. Press one of the rock wool cubes into the cup so it absorbs the water. 9. Remove the moistened rock wool cube from the graduated cup. 10. Place the other rock wool cube in the graduated cup and add water until the cube is fully soaked and the cup is full. Leave the rock wool cube in the cup. This will serve as your potted plant trial. 11. Using the ruler, measure the height of each soybean plant and record in Table 1. 12. Observe the stability, or ability of the stem to support the plant, and record in Table 1. 13. Turn on the fan and set the fan speed to low to avoid overturning your seedlings. The fan increases evaporation allowing you to make observations more quickly. 14. Arrange each of your soybean plants in front of the fan so that the air flows over each seedling evenly. 15. Observe the soybean plants every five minutes for the next 20 minutes. Record your observations in Table 1. Curriculum for Agricultural Science Education © 2014 AFNR – Activity 5.3.2 Grown in the Sun – Page 7 16. In the time between observations, use the computer and the Internet or reference books in the classroom to answer the questions in Table 2. 17. Leave your experiment overnight or until your next class period when you will make a final observation. 18. When you have made the final observation, clean up according to your teacher’s instructions. Table 1 Observations Time Bare Root 0 minutes Rockwool Potted Bare Root 5 minutes Rockwool Potted Bare Root 10 minutes Rockwool Potted Bare Root 15 minutes Rockwool Potted Bare Root 20 minutes Rockwool Potted Bare Root Next day Rockwool Potted Table 2 Roles of Water What role (or roles) does water play in each of the following? Height Stability Plant Part(s) Involved Other Answer Uptake of nutrients Transport of nutrients Photosynthesis Respiration Cell turgor Cooling and temperature control Conclusion 19. How does the availability of water to soybean plant roots aid in plant stability? 20. Describe what happens to the cell vacuole when water is plentiful. 21. What happens to the soybean plant when water is scarce? Curriculum for Agricultural Science Education © 2014 AFNR – Activity 5.3.2 Grown in the Sun – Page 8 Activity 5.3.2 Soybeans Grown in the Sun Purpose Plant maturity is determined by the accumulation of thermal units during the growing period of plants. Growing Degree Days (GDD) is the total number of heat units calculated by using the average daily temperature and subtracting a base temperature for a specific plant. The base temperature is the minimum temperature requirement a plant needs to grow. For example, a plant may require a temperature of 40 degrees. Until the temperature the plant is exposed to reaches 40 degrees, the plant will not experience any growth. If the temperature exceeds 40 degrees, the plant will accumulate GDD. Each plant has a GDD requirement based on research from growers of the specific plant variety. Therefore, you are able to predict when a plant will be mature based on examining historical climate data for your growing region. To calculate growing degree days, find the average daily temperature by adding the maximum temperature and the minimum temperature and dividing by two. Then subtract the base temperature for that plant. See the formula below. Daily GDD = (Max temp + Min temp) - 40 (base temperature) 2 Temperature for different locations depends upon many factors. Latitude and elevation are major factors that influence the average daily temperatures of an area. However, what if you wanted to raise the same crop in two different locations? How would you determine the anticipated date of harvest? Materials Per student: Highlighter Calculator Pencil Agriscience Notebook Procedure You will calculate GDD units for two different locations and determine the date of maturity for soybeans. To understand how GDD units are calculated, first you will complete a practice set of data and report the answer to your teacher. Part One – Determining GDD Units You will determine how many GDD units are accumulated for a 10-day period. The daily temperatures are listed in Table 1. The crop you are calculating the GDD for is wheat, which has a base temperature of 40° Fahrenheit. Curriculum for Agricultural Science Education © 2014 AFNR – Activity 5.3.2 Grown in the Sun – Page 9 Name: ___________________________________________________________________ Table 1 10 Day Trial Daily Low Day Temperature 1 33 Daily High Temperature 45 2 34 50 3 36 50 4 38 52 5 40 54 6 42 52 7 40 60 8 33 44 9 36 47 10 43 61 GDD Units Total GDD units for 10-Day Period Check your answer with your teacher to verify that you are correct. Part Two – Comparing Locations You will calculate when soybeans will be ready to harvest in two different geographic locations. You will assume the soybeans are planted on May 1 at each location. The total number of accumulated GDD units for soybeans to reach maturity and set pods is 1200 units. Use the temperature data in Table 2 to determine the approximate harvest date for each geographic location. Soybeans require a base temperature of 50° for growth. The maximum temperature for soybean growth is 85°. Calculate the daily growing degree days using the following formula. Record your calculation in the “Daily GDD” column. Daily GDD = (Max temp + Min temp) - 50 2 If the average temperature does not exceed 50°, enter 0 in the table. If the maximum temperature exceeds 85°, use 85° as the maximum temperature for your calculation that day as plants do not grow faster over 85°. In the “Acc GDD” column for each location, keep a running total of the accumulated GDD units until you reach the 1200 threshold. Highlight the date when each location reaches 1200 GDD units. The first three dates for each column have been done for you. Table 2 Temperature Data Indianapolis, Indiana DATE MAX MIN May 1 May 2 May 3 May 4 May 5 May 6 79 79 79 80 80 80 51 51 51 52 52 52 Daily GDD 15 15 15 Minneapolis, Minnesota Acc GDD 15 30 45 Curriculum for Agricultural Science Education © 2014 MAX MIN 67 67 68 68 68 69 46 47 47 47 48 48 Daily GDD 6.5 7 7.5 Acc GDD 6.5 13.5 21 AFNR – Activity X.X.X Name – Page 10 Name: ___________________________________________________________________ Table 2 Temperature Data Indianapolis, Indiana DATE MAX MIN May 7 May 8 May 9 May 10 May 11 May 12 May 13 May 14 May 15 May 16 May 17 May 18 May 19 May 20 May 21 May 22 May 23 May 24 May 25 May 26 May 27 May 28 May 29 May 30 May 31 June 1 June 2 June 3 June 4 June 5 June 6 June 7 June 8 June 9 June 10 June 11 June 12 June 13 June 14 June 15 June 16 June 17 June 18 June 19 June 20 June 21 June 22 80 81 81 81 81 82 82 82 83 83 83 83 84 84 84 84 85 85 85 85 86 86 86 87 87 87 87 88 88 88 88 89 89 89 89 90 90 90 90 90 90 91 91 91 91 91 91 53 53 53 54 54 54 55 55 55 56 56 56 57 57 57 58 58 58 59 59 59 59 60 60 60 61 61 61 61 62 62 62 63 63 63 63 64 64 64 64 64 65 65 65 65 65 66 Daily GDD Minneapolis, Minnesota Acc GDD Curriculum for Agricultural Science Education © 2014 MAX MIN 69 69 70 70 70 71 71 71 72 72 72 73 73 73 74 74 74 75 75 75 76 76 76 77 77 77 77 78 78 78 79 79 79 79 80 80 80 80 81 81 81 81 81 82 82 82 82 48 49 49 50 50 50 51 51 51 52 52 52 53 53 53 54 54 54 55 55 55 56 56 57 57 57 58 58 58 58 59 59 59 60 60 60 60 61 61 61 61 62 62 62 62 63 63 Daily GDD Acc GDD AFNR – Activity X.X.X Name – Page 11 Name: ___________________________________________________________________ Table 2 Temperature Data Indianapolis, Indiana DATE MAX MIN June 23 June 24 June 25 June 26 June 27 June 28 June 29 June 30 July 1 July 2 July 3 July 4 July 5 July 6 July 7 July 8 July 9 July 10 July 11 July 12 July 13 July 14 July 15 July 16 July 17 July 18 July 19 July 20 July 21 July 22 July 23 July 24 July 25 July 26 July 27 July 28 July 29 July 30 July 31 91 91 91 91 92 92 92 92 91 92 92 92 92 92 92 92 92 92 92 92 92 92 92 92 92 92 92 92 92 92 92 92 92 92 92 92 92 91 91 66 66 66 66 66 66 67 67 67 67 67 67 67 67 67 67 67 68 68 68 68 68 68 68 68 68 68 68 68 68 68 68 68 68 68 68 68 68 68 Daily GDD Minneapolis, Minnesota Acc GDD MAX MIN 82 82 82 83 83 83 83 83 84 84 84 84 84 84 84 84 84 84 84 84 84 84 84 84 84 84 84 84 84 84 84 84 84 84 84 84 84 84 84 63 63 63 64 64 64 64 64 64 64 65 65 65 65 65 65 65 65 65 65 65 65 66 66 66 66 66 66 66 66 66 66 66 65 65 65 65 65 65 Daily GDD Acc GDD Conclusion 22. When did the soybeans reach maturity in Minnesota compared to Indiana? 23. As a producer, how could you use differing maturation dates to your advantage? Curriculum for Agricultural Science Education © 2014 AFNR – Activity X.X.X Name – Page 12 Name: ___________________________________________________________________ Activity 5.3.3 Digging Up Soybean Nutrients Purpose In order to carry out the life processes of photosynthesis and respiration, plants need nutrition. Plants take in nutrients primarily from the soil through their roots. There are sixteen nutrients essential to plant growth and development. Three of those nutrients, carbon, hydrogen, and oxygen, are supplied to plants through air and water. The remaining nutrients are classified as macronutrients and micronutrients. Macronutrients are needed in relatively large amounts while micronutrients are needed in much smaller quantities. The macronutrients are further divided into primary macronutrients and secondary macronutrients. Just what are the macronutrients? Put your research skills to the test to learn more. Materials Per student: Computer with Internet access Agriscience Library Pencil Agriscience Notebook Procedure In this activity, you will research the basics of plant nutrition of soybeans. Use the Agriscience Library and the Internet to determine the information needed to complete Table 1 on Activity 5.3.3 Student Worksheet. Recommended Resources: Textbooks Parker, R. (2010). Plant and soil science: Fundamentals and applications. Clifton Park, NY: Delmar. Burton, L.D. (2010). Agriscience: fundamentals and applications (5th ed.). Clifton Park, NY: Delmar. Websites Plant Nutrients http://www.agr.state.nc.us/cyber/kidswrld/plant/nutrient.htm Guide to Symptoms of Plant Nutrient Deficiencies http://ag.arizona.edu/pubs/garden/az1106.pdf Recognizing Plant Nutrient Deficiencies http://www.unce.unr.edu/publications/files/ho/2002/fs0265.pdf Conclusion 24. Based on what you have learned, why do you think the primary nutrients are classified as such? 25. If you were asked to diagnose a nutrient deficiency, what are three plant characteristics you would look for first? Curriculum for Agricultural Science Education © 2014 AFNR – Activity X.X.X Name – Page 13 Activity 5.3.3 Student Worksheet Table 1 Macronutrients in soybeans Nutrient Function(s) in Plants Primary Macronutrients Deficiency Symptoms Source(s) Secondary Macronutrients in Soybeans Curriculum for Agricultural Science Education © 2014 AFNR – Project 5.3.4 Optimal Growth Ranges – Page 14 Project 5.3.4 Soybean Optimal Growth Ranges Purpose Plants need water, light, nutrients and warmth for optimal growth. The variables that affect plant growth are many, and agriculturalists need to consider each factor when determining which crops to grow and how to provide for the environmental requirements of plants. You have learned about individual requirements of plants, but the range of each environmental requirement for optimal growth remains a question. For instance in Lesson 5.2 All About Plants, you determined that plants need light to photosynthesize, but how much and what kind of light is needed? Find out more about plant growth requirements as you design and conduct an experiment for this project. Materials (quantities and materials vary depending upon student experiment design) Materials available per team: Per student: Soybean plants Assorted light sources Temperature control systems Assorted water sources Assorted fertilizers LabQuest2 Assorted Vernier sensors Watering device Additional materials available upon request Safety glasses Disposable gloves Computer with Internet access and word processing software Lab Report Template Lab Report Rubric Project 5.3.4 Presentation Rubric Pencil Agriscience Notebook Procedure You will work in a team of three to design and conduct an experiment on the effects of one environmental requirement of soybeans. You and your teammates will develop questions, make predictions, and design the experiment and data collection instrument. When you have completed these steps, have your teacher review your experiment. Upon receiving teacher approval, you and your teammates may conduct the experiment. Part One – Research and Predictions It will be important for you to know the environmental requirements for the soybean plant you will be testing in this experiment. Even though you are testing just one environmental factor, you will need to ensure the other environmental factors are being met and held constant. By holding the control factors constant, you eliminate variables that you are not testing. Select the factor your team will test and record below. The environmental factors that you may choose from include the following Light Nutrients (select one primary nutrient) Temperature Factor being tested: Curriculum for Agricultural Science Education © 2014 Water AFNR – Project 5.3.4 Optimal Growth Ranges – Page 15 Use the Internet and reference books in the classroom to research and record the ideal growing environment for the soybean plant you will use in the experiment. With your teammates, make a list of possible questions you may have about the optimal growth range of the environmental factor you are testing. Record your questions in Table 2 of Project 5.3.4 Planning Guide. Decide the question you and your teammates will answer in your experiment and circle that question. Now develop a prediction of what your results will be. Record your prediction in Table 2 of the planning guide. Part Two – Experimental Design Determine how you will conduct your experiment, make a list of all materials, and write set-by-step procedures in the planning guide. Use additional paper if necessary. Be sure your procedures are specific enough for another person to replicate your experiment. Experimental Specifications: Test only one factor Must have a “control” The test must include a minimum of three variations of treatments Must use three soybean plants for each test Develop a data table to collect your results in Table 2 of Project 5.3.4 Planning Guide. Part Three – Experimentation and Data Collection Once you have developed the data collection table, have your teacher review your predictions, materials, procedures, and data table. Make revisions as necessary and when your experiment has been approved, conduct the experiment. Part Four – Reporting Your Results Use the Lab Report Template to write a detailed report on your findings and scientific conclusions. You will write the lab report as an individual. Review the Lab Report Evaluation Rubric for assessment standards. As a team, prepare a three to five minute poster presentation on your research, experimental design, results, and conclusions. Use Project 5.3.4 Presentation Rubric to review the grading expectations for your presentation. Conclusion 26. Based on the environmental factor you explored, which variation was the most detrimental to soybean plant growth? 27. For your environmental factor, how did your results compare to the optimal range you researched? Curriculum for Agricultural Science Education © 2014 AFNR – Project 5.3.4 Optimal Growth Ranges – Page 16 Project 5.3.4 Planning Guide Table 1. Ideal Growing Conditions of Soybeans Light Carbon Dioxide Temperature Water Primary Nutrients Additional Information Table 2. Experimental Design Possible Questions: Prediction: Materials: Curriculum for Agricultural Science Education © 2014 AFNR – Project 5.3.4 Optimal Growth Ranges – Page 17 Table 2. Experimental Design Procedures: Data Table: Teacher Approval: Curriculum for Agricultural Science Education © 2014 AFNR – Project 5.3.4 Optimal Growth Ranges – Page 18 Curriculum for Agricultural Science Education © 2014 AFNR – Project 5.3.4 Optimal Growth Ranges – Page 19
