09-16 lecture +Q
advertisement
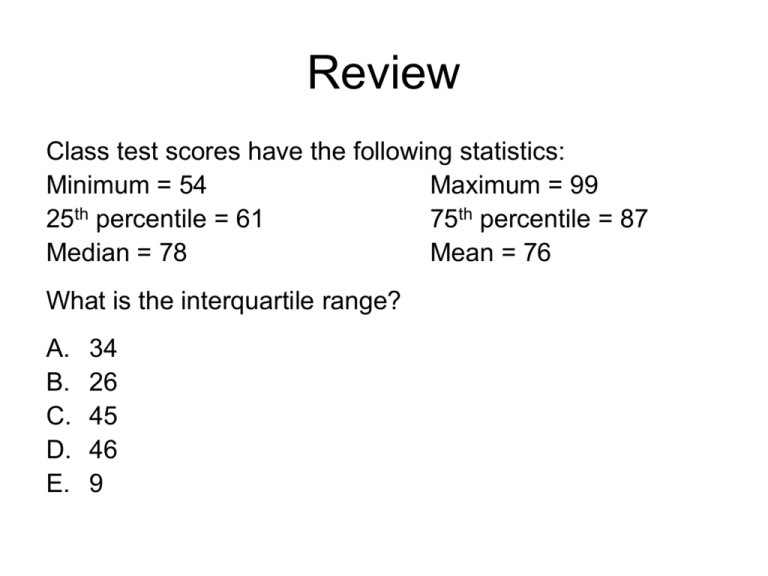
Review Class test scores have the following statistics: Minimum = 54 Maximum = 99 25th percentile = 61 75th percentile = 87 Median = 78 Mean = 76 What is the interquartile range? A. B. C. D. E. 34 26 45 46 9 Review A population of 100 people has a sum of squares of 3600. What is the standard deviation? A. B. C. D. E. 36 60 6 0.6 Not enough information Review You weigh 50 people and calculate a variance of 240. Then you realize the scale was off, and everyone’s weight needs to be increased by 5 lb. What happens to the variance? A. Increase B. Decrease C. No change z-Scores 9/16 z-Scores • How good (high, low, etc.) is a given value? • How does it compare to other scores? • Today's z-scores Solutionsanswer: from before: – Number deviations below) the mean Compareoftostandard mean, median, min,above max, (or quartiles 1 the percentile – Find • Today's answer: z-scores 2 SDs below mean 0.8 m = 3.5 Density 2 SDs above mean Raw Score Difference mean z =from +2 mean zstandard = -2 – Number of deviations above (or below) the 0.6 X m s = .5 SDs from mean z s 0.4 0.2 2:30 0 1 2 3 2.5 4 Hours 5 4.5 6 Standardized Distributions • Standardized distribution - the distribution of z-scores – – – – Start with raw scores, X Compute m, s Compute z for every subject Now look at distribution of z • Relationship to original distribution – ShapeX unchanged = [4, 8, 2, 5, 8, 5, 3] – Just change mean to 0 and standard deviation to 1 1 0.6 X –0.6 m = [-1, 3, -3, 0, 3, 0, -2] 0.4 0.2 0 -10 mean = 03 m=3 0.8 0.4 s=1 s=2 X m z 0.2 [.5, 1.4, 1.4, 0, 1.4, 0, .9] s Density Density 0.8 1 s = 2.1 m = 5, 0 -0.2 -5 0 X X z– m 5 10 Uses for z-scores • Interpretation of individual scores • Comparison between distributions • Evaluating effect sizes Interpretation of Individual Scores • z-score gives universal standard for interpreting variables – Relative to other members of population – How extreme; how likely • z-scores and the Normal distribution – If distribution is Normal, we know exactly how likely any z-score is – Other shapes give different answers, but Normal gives good rule of thumb p(Z z): 50% 16% 2% .1% 0 1 z 2 3 .003% .00003% 0.5 Density 0.4 0.3 0.2 0.1 0 -3 -2 -1 4 5 Comparison Between Distributions • Different populations – z-score gives value relative to the group – Removes group differences, allows cross-group comparison • Swede – 6’1” • Indonesian – 5’6” (m = 5’11”, s = 2”) (m = 5’2”, s = 2”) z = +1 z = +2 • Different scales – z-score removes indiosyncrasies of measurement variable – Puts everything on a common scale (cf. temperature) • IQ = 115 • Digit span = 10 (m = 100, s = 15) (m = 7, s = 2) z = +1 z = +1.5 Evaluating Effect Size • How different are two populations? – z-score shows how important a difference is – Memory drug: mdrug = 9, mpop = 7 – Important? s = 2 z = +1 • Is an individual likely a member of a population? – z-score tells chances of score being that high (or low) 0.5 – e.g., blood doping and red blood cell count 0.50.4 Density Density 0.40.3 0.30.2 0.2 0.1 0.1 0 -5 0 -3 -4 -2 -3 -1 -2 -1 0 z0 z 1 1 2 2 3 3 4 5 Review Your z-score is 0.15. This implies you are A. B. C. D. Above average Below average Exactly at the mean Not enough information Review What is the z-score for a score of 40, if µ = 50 and s = 5? A. B. C. D. -10 -.5 -2 6.25 Review What is the raw score corresponding to z = 4, if µ = 10 and s = 2? A. B. C. D. E. -3 18 2 16 12

