JKW_alpha - NMSU Astronomy
advertisement
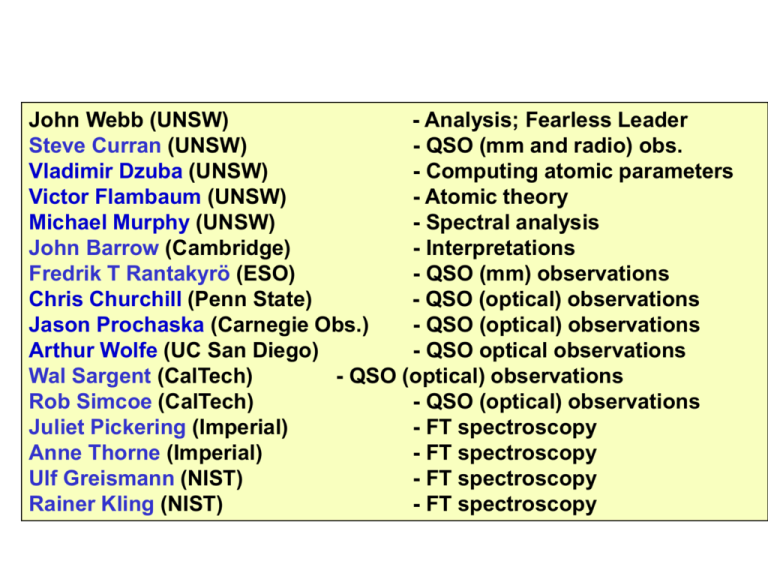
John Webb (UNSW) - Analysis; Fearless Leader Steve Curran (UNSW) - QSO (mm and radio) obs. Vladimir Dzuba (UNSW) - Computing atomic parameters Victor Flambaum (UNSW) - Atomic theory Michael Murphy (UNSW) - Spectral analysis John Barrow (Cambridge) - Interpretations Fredrik T Rantakyrö (ESO) - QSO (mm) observations Chris Churchill (Penn State) - QSO (optical) observations Jason Prochaska (Carnegie Obs.) - QSO (optical) observations Arthur Wolfe (UC San Diego) - QSO optical observations Wal Sargent (CalTech) - QSO (optical) observations Rob Simcoe (CalTech) - QSO (optical) observations Juliet Pickering (Imperial) - FT spectroscopy Anne Thorne (Imperial) - FT spectroscopy Ulf Greismann (NIST) - FT spectroscopy Rainer Kling (NIST) - FT spectroscopy Quasars: physics laboratories in the early universe quasar To Earth Lyman limit Lya Lyb SiII CII SiIV SiII CIV Lyaem Lybem NVem SiIVem CIVem The “alkali doublet method” Resonance absorption lines such as CIV, SiIV, MgII are commonly seen at high redshift in intervening gas clouds. Bethe & Salpeter 1977 showed that the l1, l2 of alkali-like doublets, i.e transitions of the sort l1 : l2 : 2 S1 / 2 2 P3 / 2 2 S1 / 2 P1 / 2 2 are related to a by l1 l2 l a 2 which leads to l l l2 l1 a ( l ) a 2l Note, measured relative to same ground state The “Many-Multiplet method” - using different multiplets and different species simultaneously order of magnitude improvement E i Ec In addition to alkali-like doublets, many other more complex species are seen in quasar spectra. Note we now measure relative to different ground states Low mass nucleus Electron feels small potential and moves slowly: small relativistic correction Represents different FeII multiplets High mass nucleus Electron feels large potential and moves quickly: large relativistic correction Dependence of atomic transition frequencies on a 1. Zero Approximation – calculate transition frequencies using complete set of Hartree-Fock energies and wave functions; 2. Calculate all 2nd order corrections in the residual electronelectron interactions using many-body perturbation theory to calculate effective Hamiltonian for valence electrons including self-energy operator and screening; perturbation V = H-HHF. This procedure reproduces the MgII energy levels to 0.2% accuracy (Dzuba, Flambaum, Webb, Phys. Rev. Lett., 82, 888, 1999) Important points: (1) size of corrections are proportional to Z2, so effect is small in light atoms; (2) greatest precision will be achieved when considering all relativistic effects (ie. including ground state) Procedure 1. Compare heavy (Z~30) and light (Z<10) atoms, OR 2. Compare s p and d p transitions in heavy atoms. Shifts can be of opposite sign. E E z z 0 Illustrative formula: a q z a 0 1 2 Ez=0 is the laboratory frequency. 2nd term is non-zero only if a has changed. q is derived from relativistic many-body calculations. Relativistic shift of the q Q K (L.S ) central line in the multiplet Numerical examples: K is the spin-orbit splitting parameter. Q ~ 10K Z=26 (s p) FeII 2383A: w0 = 38458.987(2) + 1449x Z=12 (s p) MgII 2796A: w0 = 35669.298(2) + 120x Z=24 (d p) CrII 2066A: w0 = 48398.666(2) - 1267x where x = (az/a0)2 - 1 MgII “anchor” Advantages of the new method 1. Includes the total relativistic shift of frequencies (e.g. for s-electron) i.e. it includes relativistic shift in the ground state (Spin-orbit method: splitting in excited state relativistic correction is smaller, since excited electron is far from the nucleus) 2. Can include many lines in many multiplets Jf Ji (Spin-orbit method: comparison of 2-3 lines of 1 multiplet due to selection rule for E1 J i J f 1 transitions - cannot explore the full multiplet splitting) 3. Very large statistics - all ions and atoms, different frequencies, different redshifts (epochs/distances) 4. Opposite signs of relativistic shifts helps to cancel some systematics. Wavelength precision and q values Low-z vs. High-z constraints: Low-z (0.5 – 1.8) High-z (1.8 – 3.5) ZnII FeII SiIV FeII Positive Mediocre Anchor Mediocre Negative CrII MgI, MgII Biggest shifts are around 300 m/s. Doppler searches for extra-solar planets reach ~3 m/s at similar spectral resolution (but far higher s/n). High-z Low-z vs. High-z Low-z constraints: a/a = -5×10⁻⁵ Low-z High-z Low-z vs. High-z constraints: J.K. Webb, Department of Astrophysics and Optics, School of Physics, UNSW Parameters describing ONE absorption line 3 Cloud parameters: b, N, z b (km/s) N (atoms/cm2) “Known” physics parameters: lrest, f, G... (1+z)lrest Cloud parameters describing TWO (or more) absorption lines from the same species (eg. MgII 2796 + MgII 2803 A) N b b z Still 3 cloud parameters (with no assumptions), but now there are more physics parameters Cloud parameters describing TWO absorption lines from different species (eg. MgII 2796 + FeII 2383 A) b(FeII) b(MgII) i.e. a maximum of 6 cloud parameters, without any assumptions N(FeII) N(MgII) z(FeII) z(MgII) However… b 2 observed b 2 thermal b 2 bulk 2kT cons tan t m T is the cloud temperature, m is the atomic mass So we understand the relation between (eg.) b(MgII) and b(FeII). The extremes are: A: totally thermal broadening, bulk motions negligible, b(MgII) m(Fe) b(FeII) Kb(FeII) ( m(Mg) ) B: thermal broadening negligible compared to bulk motions, b(MgII) b(FeII) We can therefore reduce the number of cloud parameters describing TWO absorption lines from different species: b Kb N(FeII) N(MgII) z i.e. 4 cloud parameters, with assumptions: no spatial or velocity segregation for different species How reasonable is the previous assumption? Line of sight to Earth Cloud rotation or outflow or inflow clearly results in a systematic bias for a given cloud. However, this is a random effect over and ensemble of clouds. FeII MgII The reduction in the number of free parameters introduces no bias in the results Numerical procedure: Use minimum no. of free parameters to fit the data Unconstrained optimisation (Gauss-Newton) nonlinear least-squares method (modified version of VPFIT, a/a explicitly included as a free parameter); Uses 1st and 2nd derivates of c2 with respect to each free parameter ( natural weighting for estimating a/a); All parameter errors (including those for a/a derived from diagonal terms of covariance matrix (assumes uncorrelated variables but Monte Carlo verifies this works well) Low redshift data: MgII and FeII (most susceptible to systematics) Low-z MgII/FeII systems: High-z damped Lyman-a systems: Current results: Current results: Current results: Current results: Potential systematic effects Laboratory wavelength errors: New mutually consistent laboratory spectra from Imperial College, Lund University and NIST Data quality variations: Can only produce systematic shifts if combined with laboratory wavelength errors Heliocentric velocity variation: Smearing in velocity space is degenerate with fitted redshift parameters Hyperfine structure shifts: same as for isotopic shifts Magnetic fields: Large scale fields could introduce correlations in a/a for neighbouring QSO site lines (if QSO light is polarised) - extremely unlikely and huge fields required Wavelength miscalibration: mis-identification of ThAr lines or poor polynomial fits could lead to systematic miscalibration of wavelength scale Pressure/temperature changes during observations: Refractive index changes between ThAr and QSO exposures – random error Line blending: Are there ionic species in the clouds with transitions close to those we used to find a/a? Instrumental profile variations: Intrinsic IP variations along spectral direction of CCD? “Isotope-saturation effect” (for low mass species) Isotopic ratio shifts: Very small effect possible if evolution of isotopic ratios allowed Atmospheric dispersion effects: Different angles through optics for blue and red light – can only produce positive a/a at low redshift Using the ThAr calibration spectrum to see if wavelength calibration errors could mimic a change in a ThAr lines Quasar spectrum Modify equations used on quasar data: quasar line: w = w0(quasar) + q1x ThAr line: w = w0(ThAr) + q1x w0(ThAr) is known to high precision (better than 0.002 cm-1) ThAr calibration results: ThAr calibration results: Conclusions and the next step 1. ~100 Keck nights; QSO optical results are “clean”, i.e. constrain a directly, and give ~6s result. Undiscovered systematics? If interpreted as due to a, a was smaller in the past. 2. 3 independent samples from Keck telescope. Observations and data reduction carried out by different people. Analysis based on a RANGE of species which respond differently to a change in alpha: (Churchill: MgII/FeII); (Prochaska: dominated by ZnII, CrII, NiII); (Sargent: all the above others eg AlII, SiII). 3. Work for the immediate future: (a) 21cm/mm/optical analyses. (b) UVES/VLT, SUBARU data, to see if same effect is seen in independent experiments; (c) new experiments at Imperial College to verify laboratory wavelengths; QSO absorption lines: A Keck/HIRES doublet H emission 2 Separation a H absorption Quasar Q1759+75 Over 60 000 data points! C IV doublet Metal absorption C IV 1548Å C IV 1550Å y/y = -1×10⁻⁵ The position of a potential interloper “X” Suppose some unidentified weak contaminant is present, mimicking a change in alpha. Parameterise its position and effect by dl, l: MgII line generated with N = 1012 atoms/cm2 b = 3 km/s Interloper strength can vary Position of fitted profile is measured The strength of a potential interloper “X” Interloper strength described by logN(X)fX. Parameterise strength relative to strength of “host” line (e.g. MgII): log10[N(X)fX/N(MgII)] Monte-Carlo simulation: vary interloper strength (y-axis) and l, measure l plausible range of parameters for strength and position of and potential interloper Photoionization equilibrium calculations: an exhaustive search for possible candidates (atomic species only) using “CLOUDY” to derive list of weak transitions, any element, any ionization….. No atomic interloper candidates were found for any species
