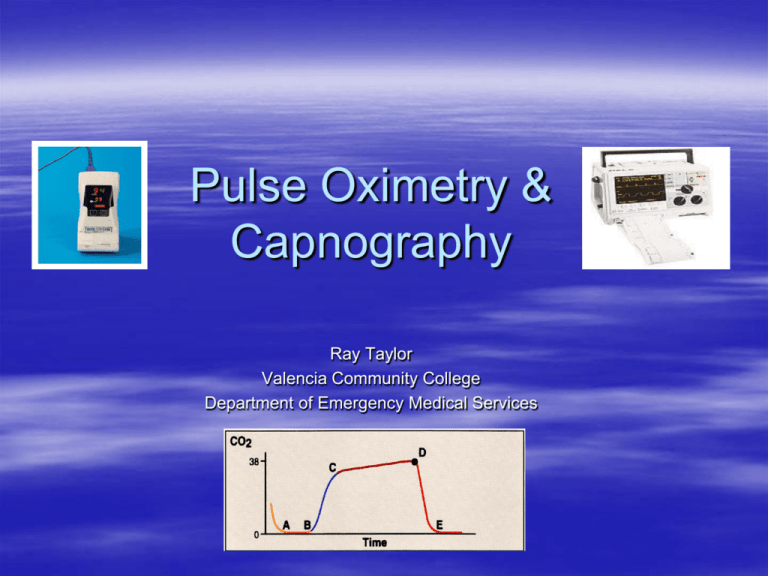
Pulse Oximetry &
Capnography
Ray Taylor
Valencia Community College
Department of Emergency Medical Services
Notice
All rights reserved.
Slide show used with permission only for
the purposes of educating emergency
medical providers (EMTs and Paramedics)
No portion of this presentation may be
reproduced, stored in a retrieval system in
any form or by any means (including but not
limited to electronic, mechanical,
photocopying etc.) without prior written
permission from the author
CAPNOGRAPHY IS THE VITAL SIGN
FOR VENTILATION
(what we should evaluate)
OXIMETRY IS THE VITAL SIGN FOR
OXYGENTATION
(what we have historically used)
Capnography
Definition:
– Noninvasive measurement of the partial pressure of
C02 in exhaled air
– Provides instantaneous information about
Ventilation
– How effectively C02 is being eliminated by the pulmonary
system
Perfusion
– How effectively C02 is being transported through the
vascular system
Metabolism
– How effectively C02 is being produced by cellular
metabolism
Physiology Review
The fundamental purpose of
ventilation and circulation is to
supply O2 to the tissues’ cells and to
remove CO2.
The conducting airways (from the
nasal/oral cavities extending to the
smallest bronchioles) serve as a
conduit for gas exchange between
the atmosphere and the cells.
– This portion of the respiratory
system is referred to as
“anatomic dead space,”
because no gas exchange
occurs there.
– On average, 30% of inspired
tidal volume is “dead”.
Respiration (gas exchange) occurs
in the alveoli.
Physiology Review
All cells produce CO2 as a
metabolic byproduct of the
oxidative breakdown of fuels.
– Factors such as body
temperature, exercise and
nutrition affect the amount of
CO2 produced.
CO2 easily diffuses out of the
cells and into the vasculature,
where it is carried back to the
right side of the heart and on to
the pulmonary system - to the
pulmonary capillaries
surrounding the alveoli.
Physiology Review
As ambient, nearly CO2-free
air is drawn into each
alveolus during inspiration,
the CO2 in the blood diffuses
across the capillary and
alveolar walls into the
alveolar space.
Normally, one pass of the
blood through the alveolar
capillary bed allows the
partial pressures of CO2 in
the alveoli and the arterial
blood to nearly equalize.
Respiratory Physiology
CO2 O 2CO2
CO2
Blood from right
side of heart
(low in O,2
high in CO)2
Aveolus
O2 O
2
CO2 CO2
.
Capillary
Red blood cells
Blood to left
side of heart
Reoxygenated blood
(high in O,2 low in CO)2
Exhalation
Exhalation can be divided into 3
phases:
– Phase 1: Expiration from dead
bronchiolar space – no CO2 yet
exhaled
– Phase 2: Mixture of dead space
air + alveolar CO2 reaches the
mouth
Known as alveolar washout and
recruitment
– Phase 3: Nearly pure, CO2-rich
alveolar air is exhaled
Called the alveolar plateau
End-tidal CO2
The peak partial pressure of
CO2 during exhalation (the
highest level of expired CO2
reached during exhalation) is
known as the end-tidal CO2
(EtCO2).
– Normally occurs at the end of
the alveolar plateau
EtCO2 is a reflection of alveolar
ventilation, CO2 production and
pulmonary blood flow.
– Can be thought of as the blood
pressure of metabolism
End-tidal CO2
In healthy people, the EtCO2 is within 5
mmHg of the partial pressure of CO2 in
arterial blood (PaCO2).
– Normal values of both are between 35-45
mmHg.
4.5% – 6 %
Normal Endtidal CO2
Normal 35-45
mmHg
Waveform reflects
how close numerical
value is to actual
end tidal volume
Square = GOOD
Hump = BAD
Depth = Height
Pulse Oximetry
The pulse oximeter is a
noninvasive device that
measures the oxygen
saturation of your patient’s
blood.
The pulse oximeter
consists of a probe
attached to the patient's
finger or ear lobe which is
linked to a computerized
unit.
How does a Pulse Oximeter work?
The probe directs two lights
(one red, one infrared)
through tissue (finger,
earlobe, etc.)
The lights are absorbed
differently depending on
oxygen attached to
hemoglobin molecule
The result is a measurement
of the patient’s oxygen
saturation on the hemoglobin
molecule
Function of Pulse Oximeter
Determines delivery of
oxygen to peripheral
tissues
Measures the oxygen
saturation of your patient’s
blood
Helps to quantify the
effectiveness of your
interventions
– oxygen therapy,
medications, suctioning,
BVM
Indications
A depressed respiratory drive (e.g., narcotic
overdose)
An increased resistance in the respiratory airways
(e.g., asthma)
A reduced capacity of the blood to transport oxygen
(e.g., shock, anemia)
All patients (additional vital sign)
SaO2 v. SpO2
PaO2 is actual amount of oxygen dissolved in arterial
blood
– measured by blood gases
– expressed in mmHg
SaO2 is percentage of hemoglobin saturated by
oxygen
– measured by blood gases
– expressed in percentage
SpO2 is percentage of hemoglobin saturated by
oxygen
– measured by pulse oximeter
– expressed in percentage
Normal Pulse Oximetry Readings
Normal lab values range between 95-100%
Readings between 93% and 97% may be
normal for some patients (COPD)
Oxygen (at minimum) should be applied for
readings below 90%
Pitfalls of the Pulse Oximeter
Certain medical conditions can alter the
machines interpretation, and give false readings
Certain environmental conditions can also
produce false reading
In the following situations the
pulse oximeter readings may not
be accurate:
A reduction in peripheral pulsatile blood flow
produced by peripheral vasoconstriction
(hypovolemia, severe hypotension, cold, cardiac
failure, some cardiac arrhythmias) or peripheral
vascular disease.
The presence of methemoglobin will prevent the
oximeter from working accurately and the
readings will tend towards 85%, regardless of
the true saturation.
In the following situations the
pulse oximeter readings may not
be accurate:
Carboxyhemoglobin( hemoglobin
combined with carbon monoxide [COHb])
is lumped in with oxyhemoglobin (O2Hb),
thus producing incorrect readings.
A person could have 15% COHb on board
(or more), plus 80% O2Hb, but the pulseOx reading would still be 95% saturation.
Pulse Oximetry v. Capnography
Oxygenation is
measured by pulse
oximetry
Ventilation is
measured and
monitored with
capnography
Comparison of
Capnograhy and Oximetry
Capnographs and pulse oximeters present different
views of the same cardiopulmonary processes.
Oximeters measure saturated hemoglobin in
peripheral blood and provide additional information
about the adequacy of lung perfusion and oxygen
delivery to the tissues.
– Many sources recommend monitoring both SpO2
and EtCO2 on intubated and non-intubated
patients.
However, pulse oximetry is a late indicator of O2
supply, and is less sensitive than capnography. It
does not afford a complete picture of ventilatory
status.
Comparison
Accurate pulse oximetry measurement is
dependent upon adequate peripheral perfusion
and may be unreliable in patients who have
compromised peripheral circulation.
Capnography continuously and nearly
instantaneously measures pulmonary ventilation
and is able to rapidly detect small changes in
cardio-respiratory function before oximeter
readings change.
Healthy patients can maintain SaO2 > 90% for
minutes even with inadequate ventilation.
Terminology
Capnos = smoke
Capnometer = number (EtCO2)
Capnograph = number + digitized signal
Capnography
(Quantitative EtCO2 Detectors)
Capnography is a form of
noninvasive monitoring of
the end-tidal carbon
dioxide (EtCO2) levels in
the patient’s exhaled
breath.
Capnography refers to a
unit that displays both a
numeric EtCO2 value and
a CO2 waveform
(capnograph).
Definitions
Capnography is the
measurement of exhaled
CO2
Capnometer gives a
numerical or quantitative
(precise) measurement of
exhaled CO2
Capnograph gives both a
numerical reading of
exhaled CO2 plus a
tracing
End-tidal CO2 (EtCO2) is
the measurement of CO2
at the end of exhalation
Cardiac ECG
Pulmonary ECG
Oxygenation and Ventilation
Oxygen -> lungs -> alveoli -> blood
Oxygen
breath
CO2
lungs
muscles + organs
Oxygen
CO2
energy
blood
CO2
cells
Oxygen
+
Glucose
Phase I (A-B)
Dead Space Ventilation
Represents the beginning of exhalation where the dead space is cleared from the
upper airway
C
A
B
I
D
E
Phase II
Ascending Phase (B – C)
Represents the rapid rise in C02 concentration in the breath stream as the C02 from
the alveoli reaches the upper airway
C
A
B
II
D
E
Phase III
Alveolar Plateau(C-D)
Represents the C02 concentration reaching a uniform level in the entire breath stream
from alveolus to the nose.
C
D
III
A
B
E
End-Tidal CO2
Point D represents the maximum C02 concentration at the end of the tidal breath
(Appropriately named end-tidal C02). This is the number that appears on the monitor
C
A
B
D
End-Tidal
E
Phase IV (D-E)
Descending Phase-Inspiratory Limb
Represents the inspiratory cycle
C
A
B
D
IV
E
Normal CO2 Waveform
Normal CO2 Waveform
How does Capnography work?
The most common
technologies utilize infrared
(IR) spectroscopy
Measures the absorption of
wavelengths of IR light by
CO2 molecules as the IR light
passes through a gas sample
The amount of IR light that is
absorbed reflects the amount
of CO2 present and
electronically calculates a
value
Mainstream/Sidestream
The value that we are most
interested in occurs at the point
of maximum exhalation and is
known as the end-tidal CO2
(EtCO2)
Clinical Application of ETC02
Verification of
endotracheal tube
placement
Continuous monitoring of
tube location during
transport
Gauging the effectiveness
of resuscitiation and
prognosis during cardiac
arrest
Titrating EtC02 levels in
patients with suspected
increases in intracranial
pressure
Determining prognosis in
trauma
Determining adequacy of
ventilation
Physiology of Capnography
During cellular respiration, small
amounts of CO2 are excreted
via exhalation
When no cellular respiration is
occurring, even if ventilation is,
there will be no CO2 exhaled
– In poor perfusion states (cardiac
arrest) no CO2 is transported to
the lungs to be exhaled, so a
low reading will occur
– In poor ventilation states
(hypoventilation) CO2 is
retained, so a high reading will
occur
ETT Algorithm
According to the AHA, in the
prehospital setting,
unrecognized misplacement of
tracheal tubes has been
reported in as many as 25%
(Katz and Falk, 2001) of
patients.
In an effort to protect against
unrecognized esophageal
intubations, current AHA training
programs strongly recommend
that CO2 detection devices be
placed on all intubated patients.
ET Tube Verification
(It can be harder than we think)
RSI
Inexperience
Facial Trauma
Blood
Syringe/Bulb
Trachlight
Infant/child
Auscultation
I just know
Combitube
Seizures
Movement
Experience
Short/fat neck
Vomitus
Recreational Drugs
Mucus
Confirmation of ET Tube
Placement
Data confirm that physical assessment
procedures to confirm ET tube placement can
be misleading.
– Movement of air through the esophagus may be difficult to
differentiate breath sounds, and may create chest rise.
– Breath sounds and/or normal chest wall expansion may be
difficult to confirm in victims with traumatic thoracic injury.
– Lung sounds can be transmitted to the epigastrium in peds
– Misting appears in a high % of esophageally-placed ET
tubes.
– Difficult to confidently confirm ET tube placement in patients
with severe bronchoconstriction.
– Unvisualized nasal ET tubes may be difficult to confirm.
Intubation
The ETT algorithm should
effectively eliminate the
possibility of an esophageal
intubation from going
undetected.
It includes a:
Physiologic method (ET CO2
detection)
Clinical method (auscultation)
Colorimetric CO2
(Qualitative EtCO2 Detectors)
When gas exchange from proper BVM or ET
ventilation is adequate, small amounts of CO2 are
excreted from the patient via exhalation.
If a sufficient concentration of CO2 is detected, the
color strip will change from purple to tan to yellow.
The yellow color indicates adequate ventilation
and good air exchange.
Colorimetric CO2
Uses litmus paper that changes
color when it comes in contact with
CO2
Will not change color if no CO2 is
flowing across paper
Color strip will change from purple
to tan to yellow
Color can change from breath to
breath
The yellow color indicates
adequate ventilation and good air
exchange
Fun Facts about Colorimetric
Devices
A Range (Purple):
<4 mmHg EtCO2
0.03% to < 0.5% EtCO2
B Range (Tan):
4 to <15 mmHg EtCO2
0.5% to < 2% EtCO2
C Range (Yellow):
15 to 38 mmHg EtCO2
2% to 5% EtCO2
Evaluate color of device after 6 full breaths.
– This allows any CO2 in the stomach (produced by the ingestion of
certain beverages and medications, or by expired air bagged into
the stomach prior to intubation) to be blown off.
– Inaccurate if contaminated with secretions, blood, emesis, acidic
meds, etc.
Pitfalls of the Colorimetric
CO2 Detection Devices
Cannot provide a specific CO2
value
Susceptible to failure if litmus
paper is contaminated with body
fluids (airway secretions, vomit,
etc.)
Has limited time value (normally
<2 hours
Subject to expiration (usually 2
years)
Six ventilations are necessary
prior to interpretation in cardiac
arrest patient to ensure potential
residual CO2 has been removed
Indications for Capnography
All intubated patients
– colorimetric
capnometer
– electronic
capnographer
AHA, NAEMSP, ACEP
all mandate use of
secondary devices to
confirm tube placement
All critical care patients
Waveform Displays
(Quantitative Device)
The waveform (capnograph)
provides a graph measured
in time of the inspiratory and
expiratory phases of the
respiratory cycle.
By interpreting the waveform
we can make a number of
assumptions about the
clinical stability of a patient
and the effectiveness of
intervention.
Capnography
The waveform is
divided into 4 phases.
Phases I, II and III
occur during, and
reflect, the three
phases of exhalation.
Phase IV occurs
during, and reflects,
inspiration.
Capnogram: Phase I
Phase I occurs during
exhalation of air from
the anatomic dead
space, which normally
contains no CO2.
This part of the curve
is normally flat,
providing a steady
baseline.
Capnogram: Phase II
Phase II occurs during
alveolar washout and
recruitment, with a
mixture of dead space
and alveolar air being
exhaled.
Phase II normally
consists of a steep
upward slope.
Capnogram: Phase III
Phase III is the alveolar
plateau, with expired gas
coming from the alveoli.
In patients with normal
respiratory mechanics, this
portion of the curve is flat,
with a gentle upward
slope.
The highest point on this
slope represents the
EtCO2 value.
Capnogram: Phase IV
Atmospheric air contains
negligible amounts of CO2.
Phase IV occurs during
inspiration, where the
EtCO2 level normally drops
rapidly to zero.
– Unless CO2 is present
in the inspired air, as
occurs when expired air
is rebreathed
This part of the waveform
is a steep, downward
slope.
Phases of ventilation
Normal capnography
Capnography Waveform Patterns
45
Normal
0
45
Hyperventilation
0
45
Hypoventilation
0
Apnea/Esophageal Intubation
Prolonged cardiac arrest with diffuse cellular death
Tracheal placement with inadequate pulmonary blood flow (poor chest compressions)
ETT obstruction
Complete airway obstruction distal to the ETT (eg, foreign body)
Technical malfunction of the monitor or tubing
Tracheal Intubation
Esophageal Intubation
No capnography reading (waveform plus or EtCO2 detection)
via your BVM, you are not in. “Full waveform is essential”
Unsuccessful Intubation
Comparison Capnograph
The tube has been extubated and is no longer in the trachea
Remove at once!!
LMA with Capnography
Abnormal Tracings
Rebreathing
Cause:
– Breathing in a mixture of both oxygen and carbon
dioxide (think rebreather mask)
Abnormal Traces
Sloping Plateau
Cause:
– Obstructive airway disease, because of
impairment of V/Q ratio.
CO2 Waveforms
Normal
Bronchospasm
Trending is Key to monitoring
Respiratory Failure
Acute exacerbation of COPD
Asthma
Pneumonia
CHF
Respiratory Muscle Fatigue
Hypoventilation Syndromes
IS THE PATIENT RESPONDING TO
THERAPY OR NOT?
Trending
Trending of
capnography provides
a continuous view of
the patient’s ventilatory
status
Early detection allows
for early intervention
Trending is a simple
tool that does not
stress an already
failing system
Video versus
Snapshot
Phases of Asthma
Hyperventilation
– mild
Tiring
– moderate
Tired
– severe
Phases of Asthma
Severe
Moderate
50+
40
40
mmHg
25-30
Mild
Normal
EtCO2 Trending
6
55 0
50
50 50
45
40
Using Capnography in Asthma
Diagnoses presence of bronchospasm
– Waveform
Assesses severity of Asthma
– EtCO2 trends
Gauges response to treatment
– EtCO2 trends
COPD
Baseline CO2 is higher
– > 50mm Hg
Follow CO2 trends to:
–Establish baseline
–Track response to treatment
COPD
Determine who is a CO2 retainer
– EtCO2 trends
COPD vs. CHF
– Waveform
Hypoventilation States
Altered mental status
45
Abnormal breathing
Hypoventilation
Hypoventilation States
Sedation
Analgesia
ETOH
intoxication
Drug Ingestion
Postictal states
Head trauma
Meningitis
Encephalitis
Abnormal Traces
Cardiac Oscillations
Cause:
– Cardiac impulses transmitted to capnograph
Abnormal Traces
“Curare cleft”
Cause:
– Asynchronous spontaneous breathing in an
intubated patient
With a poor to nonexistent waveform, the endotracheal tube is likely
in the esophagus, though consider other possible causes, such as
airway disconnection, ventilator failure, cardiac arrest (especially
with poor BLS) or decompensated shock. Remember, if no CO2 is
being exhaled, then no waveform or numerical reading will be
displayed.
60
30
0
What could a poor or non-existent wave
form indicate?
Case Study #1
32 yo 90 kg female presents in acute
respiratory distress
Cyanotic, short word sentencing
Respiratory rate is shallow and labored at 24
Expiratory phase is prolonged due to gas
trapping
Heart rate of 140, strong and bounding at the
radial
BP 170/88
Patient is clutching her Albuterol inhaler
(self-administered 15 puffs
prior to your arrival)
ETC02 value was beginning to rise
EtC02: 52 mmHg
Treatment
BLS assisted ventilations via Bag Valve Mask with
100% O2
Epinephrine 1:1000 SQ admin
Paramedic prepares for nasal intubation
Patient Arrests
As the nasal tube is being advanced,
patient arrests
Paramedic pushes the tube in anyway,
but it is found to be in the esophagus
Tube immediately withdrawn
Tube Confirmation
Cords visualized during intubation
Patient is successfully intubated orally
Auscultation reveals no discernible breath
sounds anterior chest wall
Abdominal auscultation is equally silent
Minimal chest rise
Positive misting and condensation in the
tube
Bulb aspirated syringe flows free-air
What is the next step?
Auscultation doesn't really help
SpO2 is not reading (before or after)
Remains difficult to ventilate
– What other tool can you use to confirm the
placement of the tube?
– What else could be going on with this patient?
– Are we 100% sure we are in the trachea?
YES!!! We have an ETCO2
EtC02=22 mm Hg
Case Study #2: Cardiac Arrest
42 year old 90 kg, male, involved in
motorcycle vs. truck MVA. The patient
is pinned under vehicle on highway
approx. 8 min from local hospital
•Rapid extrication performed from underneath truck
•Pt. is unresponsive with weak, irregular carotid at
150bpm, and agonal respirations weak carotid
•Patient becomes pulseless and apneic,
BLS/CPR is initiated
After intubation, the EtC02 read 25 and
then dropped to 0 when the patient was
moved
Corresponding waveform
C02 before
the patient
was
moved
After the
patient was
moved
Where is the tube????
Provider checked the number at the lip
– It had not changed
Listened to Breath Sounds
– They were less audible
The EtC02 was 25, then dropped to 0
– Normal EtC02 is between 35 to 45 mm Hg
The Endotracheal tube was removed and the
patient was reintubated
Corresponding
waveform
CO2 now back up
to 25mmHg
Case Study #3
A 12 year old boy presented in acute
respiratory failure with copious secretions
and was successfully orally intubated and
placed on a ventilator.
The patient remained obtunded, cyanotic
and had little airway movement on
auscultation.
Presentation
Unconscious &
unresponsive
Respiration's
unassisted remain
agonal
Heart rate of 136 strong
and regular at the
radial
Blood Pressure 138/56
ETCO2 32 mm HG
What does this
waveform show?
A slow upstroke and
incomplete emptyingWhat could you do
therapeutically?
Answer:
The patient was suctioned and
given a bronchodilator treatment
What does this waveform show?
Answer:
The waveform shows less
obstruction and more of an
alveolar plateau = improved
air movement
Case Study # 4
70 year old 60 kg female, status post cardiac
arrest resuscitation by EMS She was
resuscitated in the field and now being
transported to hospital. Enroute
Pt. is unconscious & unresponsive (orally
intubated and on a vent)
Vital Signs
No spontaneous respirations
BP 76/palpated
Heart rate is palpable only at the carotid at 136
weak and irregular
Cardiac monitor reveals Sinus
Arrhythmia with multi-focal PVC's
and couplets
As you are debating Dopamine you
notice a change...
EtC02 drops from 30 to 18 mm Hg
Patient’s perfusion decreases
more………….CO2 drops
further
Now unable to palpate a
carotid pulse
CPR is Initiated
CPR was continued and
palpable pulses with
compressions were present.
The improved waveform:
Cardiac compressions were
stopped and the patient was
found to be in ventricular
fibrillation
Attempt at defibrillation
was unsuccessful
Repeat defibrillation
The patient is converted
to normal sinus rhythm.
Simple use of EtC02:
Capnography can be a
useful tool in determining
the effectiveness of
pulmonary perfusion
during a cardiac arrest.
CO2 Relationship to Cardiac Output
In cardiac arrest and other low cardiac output states, the patient’s
capnography will be lower than normal.
Evaluation of Efficacy of CPR
Patients in cardiopulmonary arrest produce
no EtCO2.
During CPR (given a normal blood volume),
effective chest compressions circulate
enough blood to return CO2 from the tissue
cells to the pulmonary circuit. Combined with
effective ventilations, providers will be see
improved EtCO2 values – most likely lowerthan-normal levels.
– “EtCO2 concentration varies directly with pulmonary and
systemic blood flows under conditions of constant minute
ventilation. This relationship holds true even during
extremely low blood flow rates.” Ann Emer Med, 3/1994, 23:3, p. 571
ETCO2 is also an indication of
successful resuscitation
Sanders et al, 1989 JAMA
noted a threshold for survival of
ETCO2 >10 mmhg
Successful = 15 (+/-) 4
Unsuccessful = 7 (=/-) 5
Cardiac Arrest/Successful
Resuscitation
Predicting ROSC in Arrest
Studies have shown a correlation with EtCO2
levels during a code and ROSC. Annals of Emerg Med,
June, 1995, 25:6, pages 756-761
EtCO2 values can predict non-resuscitatable
patients.
We may see the development of protocols
utilizing EtCO2 values in conjunction with the
terminating rhythm to determine calling codes
in the field.
– Most sources cite an EtCO2 value of 10 mmHg or
less as an appropriate and predictive threshold.
This is a terminating – not initial – value,
measured after 20 minutes of standard
ACLS interventions.
Early Detection of ROSC
If the patient in cardiac arrest has a return of
spontaneous circulation, EtCO2 levels will rise
quickly to a higher level.
EtCO2 detection may be the earliest indicator
of this improvement in perfusion, and should
be confirmed by palpating for central and
peripheral pulses.
– One study showed a marked rise in EtCO2 levels
just before conversion of PEA to a perfusing
rhythm.
Before any return of measurable BP or palpable pulses!
Annals of Emergency Medicine, June, 1995, 25:6, page 762767
Causes of an Elevated
ETCO2
Metabolism
– Pain
– Hyperthermia
– Malignant hyperthermia
– Shivering
Circulatory System
– Increased cardiac output
- with constant ventilation
Respiratory System
– Respiratory
insufficiency
– Respiratory depression
– Obstructive lung
disease
Equipment
– Defective exhalation
valve
Causes of a Decreased EtCO2
Metabolism
– Overdose / sedation
– Hypothermia
Circulatory System
– Cardiac arrest
– Embolism
– Sudden hypovolemia
or hypotension
Respiratory System
– Alveolar
hyperventilation
– Bronchospasm
– Mucus plugging
Equipment
– Leak in airway system
– Partial airway
obstruction
– ETT in hypopharynx
Case Study #5
A 26 year old male is being
transported on the ventilator. Vital
signs are stable. A normal
capnographic waveform is present.
Suddenly the capnograph
changes to this:
EtC02: 5 - 20 variable
What does this mean?
What should you
check?
Check the patient first
Then check the
connections
between the ETT
and breathing circuit
And what was
found……?
Answer:
A partial disconnection causing a leak
in the circuit was detected. The problem
is corrected and the waveform returns
to normal
Summary Points
Detection device -------------> Diagnostic
monitoring
Static --------------------------> Dynamic monitoring
Advanced warning of ventilatory status
– Don’t be caught off guard
– Avoid backing into a critical situation
– Crash------------------->elective
Objective confirmation of clinical assessment
Thank you!


