Population Growth
advertisement
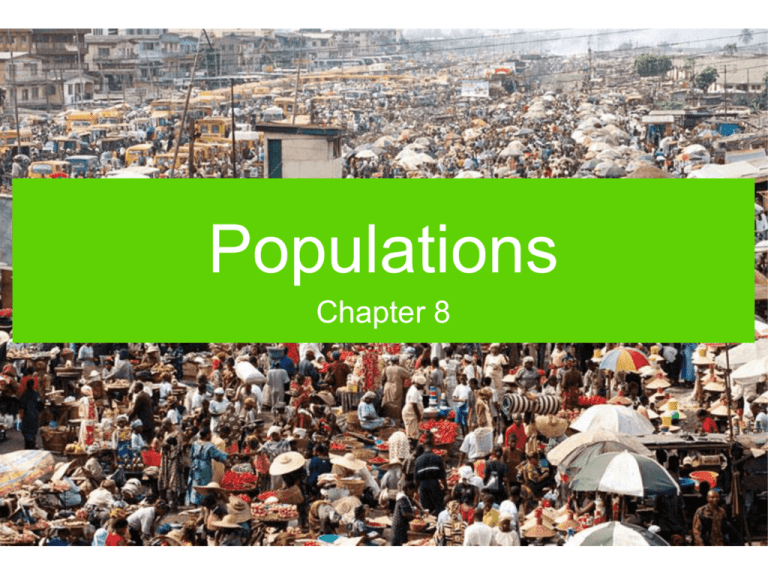
Populations Chapter 8 • Chapter 26 begins with the Mystery of Easter Island. At one time, Easter Island was forested, and supported a large population of humans who carved huge stone statues. Today the island has no forests, is sparsely populated, and the people have no memory of the culture that created the statues. What possible connections are there between the disappearance of the forests and the disappearance of the statue-carving culture? W O R K T O G E T H E R Why study populations? • In the field, populations tend to be the unit of study. A population is a natural grouping, so studying populations reflects what is going on in nature. • Even so – it’s not always easy to define a population! Population Science • Studying growth rates of populations helps us understand: • the effects of rapid overpopulation. • how population growth is regulated. • We can derive important lessons for humans from studies of populations in nature. General Principles • A population consists of members of the same species living in the same ecosystem at the same time. • Total population increases or decreases according to the number of births, deaths, immigration, and emigration that occurs. Distribution • Individuals distribute themselves in a population in three general patterns: • Clumped • Uniform • Random Distribution Clumped distribution is typical of organisms that move in groups (herds, flocks, etc.), or that cluster around resources, such as plants near a water source. Distribution Uniform distribution is typical where resources are scarce. Individuals compete to claim enough territory to support them and keep a distance from others. Distribution Random distribution is rare. Organisms may distribute randomly if resources are abundant and the organisms do not form social groups. Trees in a diverse forest may distribute randomly. Male marine iguanas are highly territorial. They also compete for females. Male iguanas tend to be distributed uniformly throughout their territory. Why? 1. They live in social groups. 2. Each male has its own distinct breeding territory. 3. The iguana’s resources are localized. 90% 5% 1 5% 2 3 Which pattern of distribution do human populations tend to show? 71% 1. Clumped 2. Uniform 3. Random 12% 1 2 17% 3 Growth Rate • To determine the actual change in numbers of a population in a given unit of time, we look at the difference between losses (deaths and emigration) and additions (births and immigration) • (births - deaths) + (immigrants emigrants) = change in population size. What is the change in a population over a ten-year period if in that time there are 9,000 births, 2,000 deaths, 800 immigrants, and 400 emigrants? 95% 1. 2. 3. 4. 1220 6600 7000 7400 0% 1 3% 2 3% 3 4 Growth Rate • If we want to know the rate (r) at which a population is increasing, we need to know: • Birth rate (b) = number of births in a population during a certain time period. Falklands Conservation • Example: 150 births in a gull population of 1000 = 150/1000 = 0.15 per year. Growth Rate • We also need to know: • Death rate (d) = number of deaths in the same time period. • Example: 50 deaths in a gull population of 1000 = 50/1000 = 0.05 per year. Falklands Conservation Growth Rate minus • Growth rate (r) = birth rate – death rate • r=b–d = • Ex: 0.15 – 0.05 = 0.1 (10% per year) percent increase Growth Rate • If we want to know the actual number of individuals by which the population increased, we use this formula: • G=rxN • G = 0.1 x 1000 = an increase of 100 individuals per year. • Try this: • You are studying a population of 30 ferns. This year you saw six new fern plants become established, and 3 fern plants died. Calculate the growth rate of the population. • Remember: r=b–d G=rxN W O R K T O G E T H E R What is the annual growth rate of a population of 10,000 sea turtles if there are 500 deaths and 1,500 births per year? 91% 1. 2. 3. 4. 5% 10% 15% 20% 6% 3% 1 2 3 0% 4 • Suppose your eccentric uncle says that for your birthday, he will give you your choice between two presents: • Choice A: $1,000,000 on your birthday. • Choice B: A penny on your birthday, two pennies the next day, four the next, and so on for 30 days. • Which would you take? Why? W O R K T O G E T H E R • Choice A yields $ 1,000,000 • Choice B yields $10,737,418.23 (Why? See: http://mathforum.org/dr/math/faq/faq.doubling. pennies.html) • What happened? Why did Choice B give you so much more money? • What does this have to do with population growth? W O R K T O G E T H E R Exponential Growth Biotic potential = Maximum growth possible. This assumes a maximized birth and minimized death rate Calculated as: r G = = b r x d N What happens to r and G when b gets big and d gets little? Exponential Growth Exponential growth produces a J-shaped population graph. Exponential Growth Age of first reproduction affects the rate of population growth. Why? Exponential Growth Death rates and average lifespan also affects growth rate. Why? • Under what conditions can exponential growth occur in nature? • You’ve probably guessed that exponential growth can’t go on forever. What factors limit population growth? W O R K T O G E T H E R Population Limits • Two opposing forces act on population growth. Environmental resistance Biotic potential Environmental Resistance • Species introduced to a new environment may experience exponential growth. • Environmental resistance will eventually limit growth. • Some populations experience “boom and bust” cycles. • Others stabilize and show logistic growth. Population Limits K= Carrying Capacity: # births = # deaths The upper limit for population growth is determined by the carrying capacity of the environment. Population Limits Available space limits barnacle populations. Where there are many natural controls, populations tend to demonstrate logistic growth. Population Limits If a population overshoots the carrying capacity of the environment, the result is a population crash. Population Limits Where there are few natural controls, a population may rise rapidly, exceed carrying capacity, then crash as most of the population starves. Which population is most likely to experience exponential growth? 1. Algae introduced into a small pond in North Dakota. 2. A migrating herd of pronghorn antelope in Eastern Oregon. 3. Chinook salmon in the Columbia River. 33% 1 33% 2 33% 3 Cyanobacteria • In July growth conditions for cyanobacteria become favorable • The population grows rapidly population boom • By early September the nutrient supply has been depleted and competition for what is left is fierce. Most cyanobacteria can’t get enough and die. How can this be represented graphically? How can the cyanobacteria example be represented graphically? 33% number 1. _ 33% 33% time 2. _ 3. _ 1 2 3 What caused the cyanobacteria to crash was environmental resistance that was: 50% 50% 1. Dependent on the density of the population. 2. Independent of the density of the population. 1 2 • This graph shows human population over the last 14,000 years. What kind of curve is this? What implications does this have for humans? bubonic plague Date Billions Time to add each billion (years) All of human 1804 1 history 1927 2 123 1960 3 33 1974 4 14 1987 5 13 1999 6 12 2012 7* 13 *projected billions of people 2012* 2006 1999 1987 1975 1960 1930 1830 Technical and cultural advances Agricultural advances Industrial and medical advances W O R K T O G E T H E R A growing population may become selflimiting. lifespan days offspring per day Population Limits population density In fruit flies, reproduction rate drops in response to crowded conditions. Population Limits Density-independent factors limit populations regardless of how large or small the population is. Usually abiotic. Examples: Seasonal weather changes Natural disasters Pollution Population Limits Density-dependent factors affect a population more strongly the larger it grows. Usually biotic. Examples: Predation Parasites Disease Resource competition Which of these is a densitydependent factor? 1. Harsh, cold winters with lots of snow and ice. 2. A sudden tornado. 3. An outbreak of cholera in a refugee camp. 4. A violent earthquake. 87% 5% 1 5% 2 3% 3 4 A population of Bluebirds is displaced when a new housing development destroys the meadow where they nested. They move to another meadow where other nine male bluebirds live. The males compete intensely for nesting sites. At the end of the season, there are still only nine successful males. Competition for nesting sites is a: 72% 1. Density-dependent factor 2. Density-independent factor 28% 1 2 A squirrel population is isolated on the Capitol grounds in Salem. Heavy traffic on all sides makes it hard for squirrels to leave the grounds. Squirrel fatalities happen as squirrels try to cross the streets. Is traffic a density-dependent or densityindependent factor for these squirrels? 50% 50% 1. Density-dependent factor. 2. Density-independent factor. 1 2 • For each of these scenarios, list both density-independent and densitydependent factors that could be involved. • During a drought, a thick stand of young pine trees is attacked by pine bark beetles. • A large herd of deer is caught by a winter storm that buries much of their food supply. Several of the deer, suffering from parasites as well as lack of food, are caught and killed by wolves. W O R K T O G E T H E R Survivorship • Populations show different patterns in survival at different ages, which in turn can affect population growth. • Early loss – many young die • Constant loss – equal loss at all ages • Late loss – high survivor of young, most deaths in old age Survivorship curves very for different species, depending on their reproductive strategy. (a) Developed countries age 2006 75 and older 60 - 74 45 - 59 30 - 44 15 - 29 0 - 14 male 2025 2050 female postreproductive (45–79 yr) reproductive (15–44 yr) prereproductive (0–14 yr) millions of people age (b) Developing countries 75 and older 60 - 74 45 - 59 30 - 44 15 - 29 0 - 14 male female millions of people Different survivorship curves can have different consequences for populations, even of the same species. Birth rates do slow down as nations become more industrialized. However, the world population is not evenly developed, and in developed nations, resource consumption per capita is high. W O R K • Based on what you have learned in Chapter 26, how can you explain the disappearance of the ancient, statuecarving culture on Easter Island? T O G E T H E R Deer and Wolves • Using the worksheets provided, calculate the population change in the deer population for each year. • Population changes = births – deaths • In this case, deaths are due to both starvation and predation. Year Wolves Deer Deer offspring Predation Starvation Deer population change 1997 10 2,000 800 400 100 300 1998 12 2,300 920 480 240 200 1999 16 2,500 1,000 640 500 -140 2000 22 2,360 944 880 180 -116 2001 28 2,224 996 1,120 26 -150 2002 24 2,094 836 960 2 -126 2003 21 1,968 788 840 0 -52 2004 18 1,916 766 720 0 46 2005 19 1,952 780 760 0 20 2006 19 1,972 790 760 0 30 3,000 30 2,500 25 2,000 20 1,500 15 1,000 10 500 5 0 0 1997 1998 1999 2000 2001 2002 2003 2004 2005 2006 Year Deer Wolves Number of Wolves Number of Deer Total Deer and Wolf Populations by Year Without wolves: exponential growth population crash How does this graph relate to your deer/wolf graph? bean weevils (prey) braconid wasp (predator) A high predator population reduces the prey population The prey population peaks when the predator population is low (a) Predators often kill weakened prey On the back of your graph: 1. Describe what happened to deer and wolf populations between 1997 and 2006. 2. What might have happened if wolves had NOT been introduced to the island? 3. Some people think it was cruel to introduce wolves. Some think it would have been cruel NOT to. Is there another management plan that would have been as good or better? Recap • Population size changes through birth, death, immigration, and emigration. • Population size is regulated by environmental restraints that increase deaths or decrease births. • Populations are distributed in various patterns for social reasons or because of resource availability.
