ecy1282-sup-0001-AppendicesA-C
advertisement
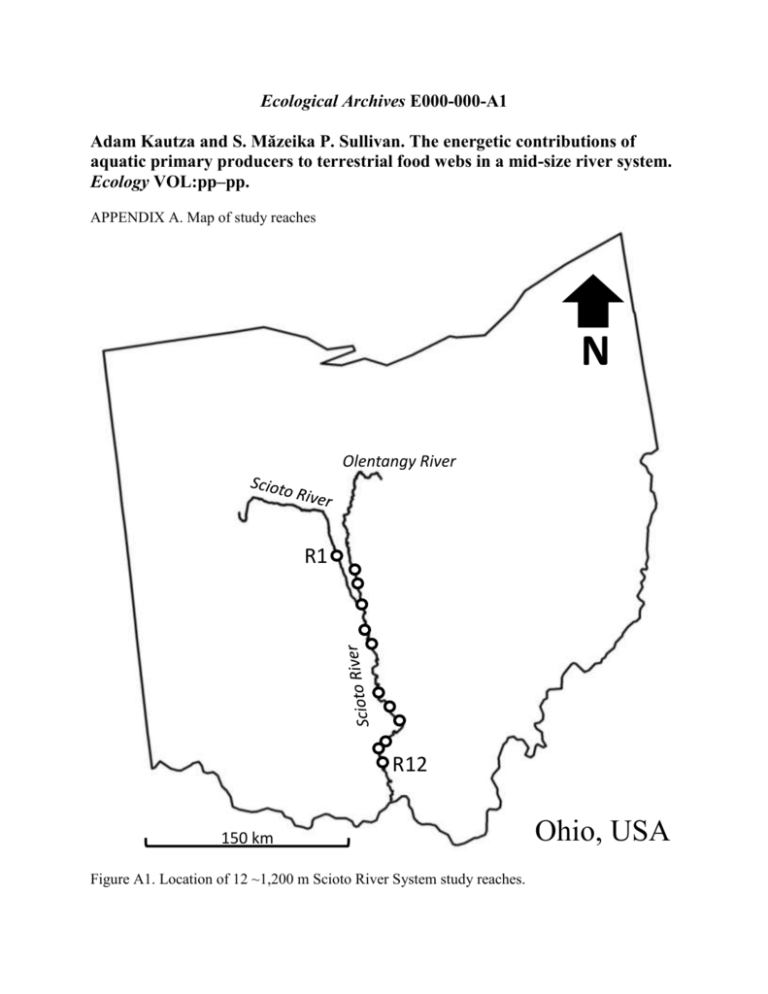
Ecological Archives E000-000-A1 Adam Kautza and S. Măzeika P. Sullivan. The energetic contributions of aquatic primary producers to terrestrial food webs in a mid-size river system. Ecology VOL:pp–pp. APPENDIX A. Map of study reaches N Olentangy River R1 R12 150 km Figure A1. Location of 12 ~1,200 m Scioto River System study reaches. Ohio, USA Ecological Archives E000-000-A2 Adam Kautza and S. Măzeika P. Sullivan. The energetic contributions of aquatic primary producers to terrestrial food webs in a mid-size river system. Ecology VOL:pp–pp. Appendix B. Additional details related to methodology. Riparian swallows We captured aerial insectivorous birds (riparian swallow species; Hirundinidae) from each reach using mist nets or nest boxes (see Alberts et al. 2013 for details relative to nest-box methodology). We positioned mist nets (2.7 x 12 m, 30-mm mesh) in the most likely locations (i.e., near shore, across sections of the river) to intercept birds based on observations of local swallow behavior and flight patterns. We set and monitored mist nets during periods of greatest bird activity (e.g., morning and late afternoon/evening) and immediately removed any bird intercepted by the net. All bird collections were conducted during the breeding season (approximately June-July in our study area; 2010–2013) as daily movement patterns of swallows are constrained to areas around the nest during this time. The swallow species [bank (Riparia riparia), cliff (Petrochelidon pyrrhonota), northern rough-winged (Stelgidopteryx serripennis), and tree (Tachycineta bicolor) swallows] of our study are obligate aerial insectivores that breed in river-riparian ecosystems offering appropriate nesting sites [e.g., tree cavities (tree swallows), vertical river banks (bank and northern rough-winged swallows), and bridges (cliff swallows); Robertson et al. 1992, Brown and Brown 1995, DeJong 1996, Garrison 1999]. We banded all captured birds with aluminum USFWS size 0 bands (bank and northern rough-winged swallows) or size 1 bands (cliff and tree swallows). We drew blood from the jugular vein of adult swallows for use in stable isotope analysis following Sullivan and Vierling (2012) and Alberts et al. (2013). We revisited each reach and continued to capture birds until we collected blood from at least 6 individuals (except at R5 where we only captured two birds). Raccoons We trapped raccoons (Procyon lotor) in box traps (Tomahawk Live Trap Co., Tomahawk, WI), baited with marshmallows and anise extract, during July and August 2012–2014. Bait was only used as an attractant and was unavailable for raccoon consumption. We deployed traps overnight in the riparian area along the length of each reach and within 50 m of the river and checked traps at dawn the following morning. We used an intramuscular injection of Telazol to immobilize captured raccoons following Gehrt et al. (2001). During the period of immobilization, we drew blood (for use in stable isotope analysis) from the jugular vein. We were able to sample raccoons from 10 of 12 study reaches. At five of 12 reaches we captured two raccoons, with one individual sampled at each of the remaining five reaches. All trapping and handling of raccoons followed the guidelines of the American Society of Mammology (Sikes et al. 2011). Literature Cited Alberts, J. M., S. M. P. Sullivan, and A. Kautza. 2013. Riparian swallows as integrators of landscape change in a multiuse river system: implications for aquatic-to-terrestrial transfers of contaminants. Science of the Total Environment 463:42-50. Brown, C. R., and M. B. Brown. 1995. Cliff Swallow Hirundo pyrrhonota. Birds of North America Species Account #149. The Academy of Natural Sciences of Philadelphia and the American Ornithologists Union, Philadelphia, PA. 32 pages. DeJong, M. J. 1996. Northern rough-winged swallow Stelgidopteryx serripennis. Birds of North America Species Account #234. The Academy of Natural Sciences of Philadelphia and the American Ornithologists Union, Philadelphia, PA. 24 pages. Garrison, B. A. 1999. Bank swallow Riparia riparia. Birds of North America Species Account #414. The Academy of Natural Sciences of Philadelphia and the American Ornithologists Union, Philadelphia, PA. 28 pages. Gehrt, S. D., L. L. Hungerford, and S. Hatten. 2001. Drug effects on recaptures of raccoons. Wildlife Society Bulletin 29:833-837. Robertson, R. J., B. J. Stutchbury, and R. R. Cohen. 1992. Tree swallow Tachycineta bicolor. Birds of North America Species Account #11. The Academy of Natural Sciences of Philadelphia and the American Ornithologists Union, Philadelphia, PA. 26 pages. Sikes, R. S., W. L. Gannon, and the Animal Care and Use Committee of the American Society of Mammalogists. 2011. Journal of Mammology 92:235-253. Sullivan, S. M. P., and K. T. Vierling. 2012. Exploring the influences of multiscale environmental factors on the American dipper Cinclus mexicanus. Ecography 35:624636. Ecological Archives E000-000-A3 Adam Kautza and S. Măzeika P. Sullivan. The energetic contributions of aquatic primary producers to terrestrial food webs in a mid-size river system. Ecology VOL:pp–pp. APPENDIX C. Additional reach- and taxon-specific results. Table C1. Mean and SD (in parentheses) for δ13C and δ15N of aquatic and terrestrial primary producers and terrestrial riparian secondary consumers at the 12 Scioto River study reaches. Raccoons were not observed at two study reaches (R1 and R6). Primary producers Benthic algae R1 R2 R3 R4 R5 R6 R7 Phytoplankton Aquatic macrophytes Terrestrial vegetation δ13C -21.12 (1.34) -29.99 (1.42) -28.91 (0.66) -26.68 (0.31) δ15N 11.07 (2.03) 9.21 (2.06) 13.04 (0.87) 5.46 (0.14) δ13C -22.57 (3.61) -31.35 (3.39) -29.47 (0.49) -28.45 (0.60) δ15N 10.95 (0.92) 8.22 (2.09) 12.84 (0.62) 3.13 (0.21) δ13C -17.22 (0.84) -33.08 (1.99) -28.83 (0.13) -28.05 (1.17) δ15N 8.42 (1.31) 9.42 (1.22) 12.13 (0.17) 3.19 (0.36) δ13C -24.00 (2.43) -32.44 (3.28) -29.73 (0.78) -28.87 (0.61) δ15N 9.75 (2.62) 10.12 (2.52) 12.94 (1.13) 5.91 (0.21) δ13C -23.58 (0.20) -30.70 (0.27) -28.79 (0.82) -28.04 (0.59) δ15N 9.86 (1.43) 8.64 (1.42) 13.86 (0.37) 6.86 (0.01) δ13C -20.64 (1.61) -31.43 (1.77) -28.38 (0.30) -27.45 (1.17) δ15N 8.90 (1.78) 9.80 (1.03) 10.06 (0.22) 6.52 (0.64) δ13C -21.48 (3.28) -31.60 (2.71) -28.24 (0.68) -27.97 (0.42) R8 R9 R10 R11 R12 δ15N 8.51 (1.11) 8.65 (0.69) 14.24 (1.69) 7.19 (0.18) δ13C -22.51 (4.40) -31.13 (3.51) -29.64 (0.84) -26.87 (0.57) δ15N 9.18 (1.13) 8.41 (2.51) 13.75 (1.10) 5.48 (0.41) δ13C -21.33 (5.43) -32.46 (4.21) -29.01 (0.27) -28.62 (0.42) δ15N 11.79 (0.86) 10.41 (0.40) 11.28 (0.23) 7.23 (0.10) δ13C -22.67 (1.05) -33.01 (3.76) -30.58 (1.07) -28.39 (1.07) δ15N 8.84 (1.13) 10.03 (0.23) 12.13 (1.34) 5.40 (0.08) δ13C -22.25 (5.72) -32.58 (3.27) -29.35 (0.65) -29.14 (1.11) δ15N 9.00 (1.32) 11.33 (1.65) 12.44 (1.59) 5.22 (0.04) δ13C -21.84 (6.48) -32.20 (3.10) -27.93 (0.44) -28.26 (0.93) δ15N 9.69 (2.27) 9.50 (0.97) 11.06 (1.69) 5.09 (0.17) Table C1 (continued). Terrestrial consumers Orb-weaving spiders (Tetragnathidae) Rove beetles (Staphylinidae) Narrow-wing damselflies (Coenagrionidae) Riparian swallows (Hirundinidae) Raccoons (Procyon lotor) -26.38 (0.35) -25.85 (0.64) -25.82 (0.62) -24.73 (0.40) - 13.82 (0.39) 12.33 (0.76) 12.47 (0.57) 10.35 (0.30) - -27.87 (1.60) -29.19 (0.95) -26.97 (0.21) -24.55 (0.66) -21.52 (0.75) 12.00 (1.21) 7.90 (1.12) 10.52 (0.84) 11.00 (0.44) 7.97 (0.55) -30.54 (0.59) -24.08 (2.87) -28.50 (1.01) -24.38 (0.52) -20.39 (-) 13.46 (0.34) 7.60 (0.39) 12.32 (0.98) 10.14 (0.93) 7.95 (-) -28.05 (0.41) -26.52 (1.01) -27.19 (2.08) -25.88 (0.51) -22.70 (0.25) 12.30 (1.91) 10.31 (1.09) 12.33 (1.37) 12.16 (1.25) 7.91 (0.68) -27.55 (1.05) -26.28 (2.23) -25.61 (1.54) -24.88 (1.03) -22.53 (-) 12.09 (0.58) 10.95 (1.20) 10.55 (1.25) 9.72 (0.06) 10.60 (-) -26.90 (0.09) -24.92 (2.16) -26.71 (0.95) -24.26 (0.93) - 12.46 (0.30) 9.92 (0.91) 12.77 (1.16) 11.03 (1.05) - -27.68 (0.10) -28.96 (1.75) -27.75 (1.37) -22.73 (1.05) -22.83 (-) 11.30 (1.02) 8.92 (1.71) 11.12 (0.71) 8.64 (0.19) 9.01 (-) -27.94 (0.57) -26.19 (0.45) -27.36 (0.30) -26.75 (0.79) -24.80 (0.29) 12.36 (0.57) 9.72 (0.27) 11.34 (1.24) 12.78 (0.90) 9.71 (0.68) -27.76 (0.32) -26.34 (1.27) -27.72 (1.84) -24.42 (0.71) -23.51 (0.35) 12.71 (0.67) 9.93 (0.60) 11.77 (0.57) 10.37 (0.85) 10.13 (0.04) -27.13 (0.79) -24.96 (1.44) -26.49 (1.03) -23.36 (0.24) -20.00 (0.77) 14.00 (2.28) 10.68 (1.77) 11.28 (1.53) 7.91 (0.77) 7.37 (0.93) -27.00 (1.35) -26.44 (0.59) -26.40 (0.98) -25.15 (0.34) -16.87 (-) 11.90 (0.72) 11.72 (1.15) 12.04 (1.90) 10.87 (0.47) 7.78 (-) -25.91 (1.99) -25.94 (1.47) -26.77 (0.54) -24.28 (0.75) -16.65 (-) 12.25 (0.65) 8.09 (0.19) 12.23 (1.48) 11.15 (1.00) 8.66 (-) Table C2. Mean proportional contributions and 95% credible intervals of aquatic (periphyton, phytoplankton, macrophytes) and terrestrial primary producer sources to terrestrial riparian consumers. Estimates of means and variability of nutritional contributions were derived from the Bayesian stable isotope mixing model MixSIAR (Stock and Semmens 2013) in R (R Core Team 2014). All Tetraganthidae Staphylinidae Source Mean 95% CI Mean 95% CI Mean 95% CI Periphyton 0.07 0.004-0.21 0.07 0.001-0.24 0.07 0.002-0.22 Phytoplankton 0.21 0.03-0.51 0.24 0.01-0.69 0.22 0.01-0.53 Macrophytes 0.17 0.02-0.37 0.23 0.01-0.52 0.17 0.01-0.37 Terrestrial 0.55 0.12-0.74 0.46 0.17-0.68 0.54 0.23-0.82 Periphyton 0.19 0.08-0.31 0.08 0.01-0.28 0.04 0.01-0.15 Phytoplankton 0.22 0.03-0.57 0.35 0.003-0.77 0.29 0.001-0.75 Macrophytes 0.08 0.02-0.27 0.13 0.003-0.37 0.04 0.002-0.15 Terrestrial 0.51 0.17-0.74 0.44 0.05-0.84 0.63 0.07-0.93 Periphyton 0.15 0.04-0.22 0.06 0.004-0.16 0.04 0.01-0.17 Phytoplankton 0.27 0.11-0.59 0.51 0.26-0.79 0.07 0.01-0.21 Macrophytes 0.08 0.001-0.18 0.12 0.002-0.23 0.03 0.00-0.08 Terrestrial 0.50 0.18-0.69 0.31 0.05-0.54 0.86 0.66-0.96 Periphyton 0.10 0.01-0.29 0.07 0.004-0.25 0.08 0.003-0.25 Phytoplankton 0.14 0.01-0.52 0.16 0.003-0.60 0.12 0.003-0.44 Macrophytes 0.15 0.01-0.37 0.17 0.004-0.54 0.12 0.005-0.29 Terrestrial 0.61 0.27-0.90 0.60 0.14-0.93 0.68 0.25-0.94 Periphyton 0.14 0.003-0.36 0.05 0.004-0.24 0.04 0.001-0.18 Phytoplankton 0.17 0.01-0.36 0.36 0.01-0.73 0.19 0.05-0.42 Macrophytes 0.03 0.001-0.13 0.03 0.00-0.20 0.02 0.00-0.09 Terrestrial 0.66 0.33-0.88 0.56 0.16-0.90 0.75 0.44-0.99 Periphyton 0.13 0.01-0.45 0.08 0.01-0.25 0.10 0.003-0.30 Phytoplankton 0.16 0.01-0.51 0.23 0.01-0.59 0.11 0.01-0.28 Macrophytes 0.20 0.01-0.46 0.29 0.02-0.60 0.11 0.01-0.25 Terrestrial 0.51 0.23-0.79 0.40 0.10-0.81 0.68 0.40-0.91 Periphyton 0.19 0.01-0.45 0.13 0.003-0.40 0.10 0.004-0.25 Phytoplankton 0.26 0.02-0.54 0.33 0.01-0.71 0.31 0.02-0.74 Macrophytes 0.08 0.002-0.17 0.07 0.001-0.30 0.09 0.001-0.18 Terrestrial 0.47 0.06-0.73 0.47 0.10-0.89 0.50 0.11-0.79 Periphyton 0.08 0.004-0.28 0.08 0.002-0.33 0.06 0.001-0.16 Phytoplankton 0.22 0.01-0.60 0.28 0.01-0.69 0.21 0.01-0.80 Macrophytes 0.10 0.01-0.29 0.13 0.003-0.43 0.06 0.001-0.15 Terrestrial 0.60 0.17-0.86 0.51 0.10-0.88 0.67 0.05-0.98 Periphyton 0.10 0.04-0.28 0.06 0.01-0.24 0.07 0.01-0.22 Phytoplankton 0.16 0.02-0.43 0.19 0.02-0.57 0.14 0.01-0.58 Macrophytes 0.12 0.01-0.26 0.24 0.01-0.60 0.08 0.001-0.23 Terrestrial 0.62 0.26-0.83 0.51 0.12-0.91 0.71 0.31-0.97 Periphyton 0.19 0.02-0.63 0.11 0.01-0.44 0.09 0.001-0.33 Phytoplankton 0.08 0.004-0.33 0.14 0.001-0.53 0.06 0.001-0.39 Macrophytes 0.07 0.002-0.21 0.19 0.001-0.54 0.02 0.001-0.20 Terrestrial 0.66 0.33-0.92 0.56 0.12-0.90 0.83 0.32-0.99 Periphyton 0.17 0.08-0.39 0.16 0.02-0.36 0.16 0.02-0.39 Phytoplankton 0.12 0.004-0.36 0.13 0.002-0.52 0.12 0.002-0.42 Macrophytes 0.15 0.01-0.29 0.15 0.002-0.44 0.16 0.002-0.41 Terrestrial 0.56 0.29-0.79 0.56 0.18-0.90 0.56 0.23-0.89 Periphyton 0.14 0.05-0.40 0.13 0.03-0.37 0.08 0.01-0.17 Phytoplankton 0.10 0.01-0.27 0.11 0.004-0.44 0.06 0.001-0.14 Macrophytes 0.14 0.01-0.33 0.16 0.01-0.53 0.08 0.001-0.15 Terrestrial 0.62 0.36-0.77 0.60 0.20-0.86 0.78 0.61-0.90 Table C2 (continued). Coenagrionidae Riparian swallows Raccoons Mean 95% CI Mean 95% CI Mean 95% CI 0.07 0.002-0.20 0.06 0.001-0.17 - - 0.22 0.02-0.50 0.17 0.01-0.40 - - 0.17 0.02-0.37 0.12 0.01-0.23 - - 0.54 0.30-0.76 0.65 0.39-0.83 - - 0.09 0.04-0.25 0.33 0.22-0.45 0.39 0.01-0.77 0.20 0.01-0.55 0.12 0.01-0.28 0.15 0.01-0.75 0.12 0.01-0.27 0.09 0.01-0.23 0.04 0.00-0.08 0.59 0.28-0.86 0.46 0.24-0.60 0.42 0.13-0.92 0.04 0.01-0.18 0.25 0.15-0.37 0.30 0.07-0.91 0.52 0.22-0.67 0.12 0.04-0.28 0.15 0.003-0.29 0.11 0.01-0.21 0.08 0.001-0.15 0.08 0.001-0.17 0.33 0.18-0.60 0.55 0.37-0.68 0.47 0.16-0.97 0.09 0.01-0.29 0.11 0.01-0.31 0.15 0.00-0.58 0.15 0.01-0.50 0.13 0.01-0.43 0.13 0.02-0.60 0.16 0.01-0.37 0.17 0.01-0.47 0.12 0.002-0.23 0.60 0.22-0.87 0.59 0.24-0.84 0.60 0.10-0.98 0.06 0.002-0.31 0.13 0.001-0.47 0.44 0.14-0.86 0.09 0.003-0.35 0.08 0.001-0.35 0.11 0.002-0.49 0.02 0.001-0.12 0.02 0.00-0.14 0.04 0.00-0.26 0.83 0.46-0.99 0.77 0.30-0.98 0.41 0.05-0.90 0.09 0.02-0.28 0.24 0.01-0.49 - - 0.21 0.01-0.50 0.09 0.01-0.31 - - 0.31 0.06-0.79 0.09 0.004-0.30 - - 0.39 0.17-0.69 0.58 0.21-0.88 - - 0.10 0.003-0.41 0.35 0.22-0.59 0.28 0.12-0.43 0.33 0.01-0.76 0.14 0.01-0.52 0.20 0.01-0.60 0.14 0.003-0.39 0.03 0.001-0.16 0.07 0.00-0.16 0.43 0.08-0.83 0.48 0.10-0.77 0.45 0.13-0.81 0.09 0.004-0.28 0.10 0.002-0.43 0.09 0.001-0.27 0.24 0.01-0.61 0.20 0.01-0.56 0.17 0.03-0.40 0.10 0.01-0.29 0.14 0.01-0.43 0.07 0.001-0.15 0.57 0.15-0.88 0.56 0.13-0.90 0.67 0.22-0.97 0.07 0.01-0.28 0.14 0.04-0.28 0.15 0.004-0.31 0.20 0.01-0.62 0.11 0.01-0.41 0.16 0.01-0.69 0.13 0.002-0.44 0.07 0.004-0.24 0.09 0.00-0.18 0.60 0.09-0.92 0.68 0.29-0.89 0.60 0.08-0.96 0.07 0.001-0.29 0.22 0.01-0.43 0.45 0.09-0.87 0.10 0.001-0.47 0.04 0.001-0.28 0.08 0.001-0.80 0.09 0.001-0.43 0.02 0.001-0.19 0.03 0.001-0.13 0.74 0.33-0.99 0.72 0.36-0.95 0.44 0.21-0.69 0.16 0.02-0.36 0.19 0.09-0.38 0.19 0.03-0.60 0.12 0.002-0.52 0.11 0.004-0.35 0.12 0.001-0.74 0.16 0.002-0.45 0.13 0.004-0.30 0.15 0.003-0.35 0.56 0.16-0.90 0.57 0.29-0.78 0.54 0.12-0.85 0.09 0.01-0.29 0.20 0.09-0.39 0.20 0.002-0.51 0.15 0.002-0.52 0.07 0.01-0.26 0.10 0.001-0.23 0.21 0.004-0.61 0.12 0.01-0.32 0.13 0.002-0.21 0.55 0.15-0.89 0.61 0.37-0.78 0.57 0.14-0.90 Table C3. Abundance and biomass (mg) of Chironomidae, the most numerically-dominant emergent aquatic insect family collected from floating emergent insect traps across the 12 study reaches. Also shown are mixing model (MixSIAR) estimates for the nutritional contributions of primary producers to adult Chironomidae and crayfish, which are both potentially important prey for a suite of terrestrial riparian consumers. Included are total estimated contributions from all aquatic primary producer sources, as well as from each individual source (periphyton, phytoplankton, and macrophytes). Estimates of the total available biomass of aquatic versus terrestrially-derived nutritional subsidies (i.e., energy) transported to terrestrial riparian consumers via emerging chironomids was calculated by multiplying emergent chironomid biomass by the reliance (%) on aquatic vs. terrestrially primary producers assessed from stable isotope mixing models. R1 R2 R3 R4 R5 R6 Abundance 3,402 2,737 1,357 2,606 6,145 5,316 Biomass (mg) 197.9 326.4 152.4 505.1 1,398.3 636.2 78 70 74 36 48 60 7 17 5 4 8 3 Phytoplankton (%) 61 25 49 22 31 24 Macrophytes (%) 10 28 20 10 9 34 43.5 97.9 39.6 323.3 727.1 254.5 154.4 228.5 112.8 181.8 671.2 381.7 Chironomidae Aquatically-derived energy sources contributing to Chironomidae Total (%) Periphyton (%) Biomass of energy sources transported in Chironomidae (mg) From terrestrial detritus From aquatic primary producers Crayfish (Orconectes rusticus) Aquatically-derived energy sources contributing to crayfish Total (%) 61 53 62 51 49 61 Periphyton (%) 13 8 4 7 3 6 Phytoplankton (%) 31 28 40 23 32 32 Macrophytes (%) 17 17 18 21 14 23 Table C3 (continued). R7 R8 R9 R10 R11 R12 MEAN SD 10,333 5,821 11,068 3,278 1,608 1,789 4,621.7 3,262.6 2,373.3 762.3 2,699.2 1,217.0 739.3 574.4 965.2 823.7 35 47 42 65 45 43 54 15 5 12 3 29 9 10 9 7 19 19 9 13 19 15 26 15 11 16 30 13 17 18 18 8 1,542.6 404.0 1,565.5 669.4 406.6 327.4 329.3 238.1 830.7 358.3 1,133.7 547.7 332.7 247.0 367.9 227.9 65 55 63 63 57 62 59 5 8 12 8 17 10 9 9 4 34 24 17 15 14 17 26 9 23 19 38 31 33 36 24 8 Figure C1. Reliance on aquatically-derived (separated into periphyton, phytoplankton, and aquatic macrophyte compartments) and terrestrially-derived energy by a suite of terrestrial consumers at 12 reaches across the Scioto River system, Ohio, USA. “NA” for R1 and R6 indicates that no raccoons were captured at these reaches. Estimates are based on Bayesian mixing models using MixSIAR (Stock and Semmens 2013) in R (R Core Team 2014). Literature Cited R Core Team. 2014. R: A language and environment for statistical computing. R Foundation for Statistical Computing, Vienna, Austria. http://www.R-project.org/ Stock, B. C., and B. X. Semmens. 2013. MixSIAR GUI User Manual, version 1.0. http://conserver.iugo-cae.org/user/brice.semmens/MixSIAR.
