Middle School STEM Science Lab/Activity Planner Name of Lab
advertisement
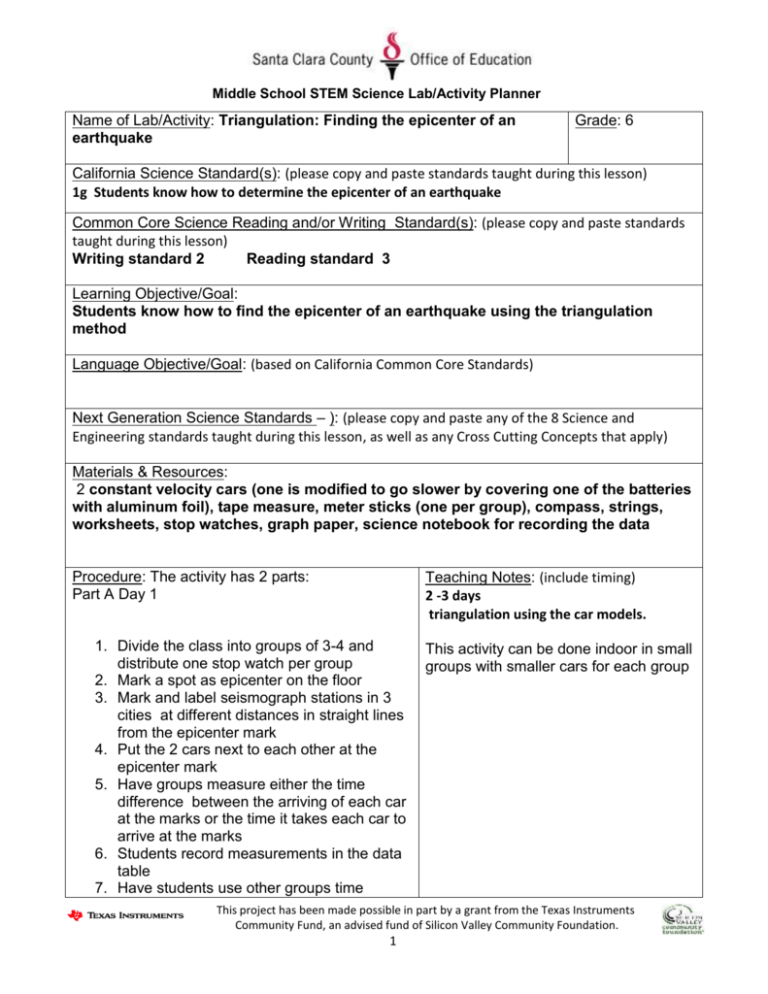
Middle School STEM Science Lab/Activity Planner Name of Lab/Activity: Triangulation: Finding the epicenter of an earthquake Grade: 6 California Science Standard(s): (please copy and paste standards taught during this lesson) 1g Students know how to determine the epicenter of an earthquake Common Core Science Reading and/or Writing Standard(s): (please copy and paste standards taught during this lesson) Writing standard 2 Reading standard 3 Learning Objective/Goal: Students know how to find the epicenter of an earthquake using the triangulation method Language Objective/Goal: (based on California Common Core Standards) Next Generation Science Standards – ): (please copy and paste any of the 8 Science and Engineering standards taught during this lesson, as well as any Cross Cutting Concepts that apply) Materials & Resources: 2 constant velocity cars (one is modified to go slower by covering one of the batteries with aluminum foil), tape measure, meter sticks (one per group), compass, strings, worksheets, stop watches, graph paper, science notebook for recording the data Teaching Notes: (include timing) 2 -3 days triangulation using the car models. Procedure: The activity has 2 parts: Part A Day 1 1. Divide the class into groups of 3-4 and distribute one stop watch per group 2. Mark a spot as epicenter on the floor 3. Mark and label seismograph stations in 3 cities at different distances in straight lines from the epicenter mark 4. Put the 2 cars next to each other at the epicenter mark 5. Have groups measure either the time difference between the arriving of each car at the marks or the time it takes each car to arrive at the marks 6. Students record measurements in the data table 7. Have students use other groups time This activity can be done indoor in small groups with smaller cars for each group This project has been made possible in part by a grant from the Texas Instruments Community Fund, an advised fund of Silicon Valley Community Foundation. 1 measurements to make averages of the time travelled by each car and record in the data table 8. Students then construct a graph showing the difference in time (y axis) versus the distance (x axis) Part B Day 2 The teacher will measure and mark the 3 cities from an epicenter prior to the activity (can be done outdoors). 1. In pairs, students will pick a city, and use the graph to determine the distance and measure it on a piece of string and cut the string 2. Students go outside and line up behind their marked city 3. One city at the time, one student stands still at the city mark and the other student walks outward revolving around the marked city (see diagram 1) 4. The second pair will do the same thing revolving around the second city(see diagram 2) 5. They should notice that they intersect at 2 points 6. Then the third pair revolves around the 3rd city.(see diagram 3) 7. They should notice that now they intersect at only one point which is the epicenter of the earthquake. 8. Students will follow up this activity with the next activity (lesson 2) using a compass to find the epicenter Math Connection (Including CCSS Math Practice(s): Teaching Notes: Measuring time using stop watches Measurement, graphing, This project has been made possible in part by a grant from the Texas Instruments Community Fund, an advised fund of Silicon Valley Community Foundation. 2 Technology Used to Extend Learning: Teaching Notes: www.geo.mtu.edu/UPSeis/waves.html Animation of P and S waves, using calculators and stop watches Teaching Notes: Have students explain the activity in a paragraph answering the following questions: * What do points A, B, and C represent? * What do the cars represent? * Which Car represents S-waves? * Which car represents P-waves? * How did you find the average? For EL students make a cloze paragraph explaining the activity with blanks to be filled with content vocabulary. Paragraph is attached. Formative Assessment: (please attach a copy) How accurately they can find the epicenter Strategies for EL & Special Needs Students (ELD CCSS: Vocabulary: P-waves, S-waves, love waves, epicenter, focus, triangulation, seismic waves, seismogram Alignment in science unit: (Brief description of lessons taught prior to & after this lab/activity) Prior to the activity: Animation of P and S waves from www.geo.mtu.edu/UPSeis/waves.html After the activity Finding the epicenter of an earthquake using compass. Brief description of lessons taught after this lab/activity: Students practice triangulation using a compass. (the 2nd activity lesson) Lab/Activity adapted from: (website, Formative Assessment adapted from: textbook, etc.) Dan Burns Science teacher This lesson was developed by: Teacher’s Name Ron Humby Maryam Raymond Currently Teaching at: (School & District) Willow Glen MS SJUSD This project has been made possible in part by a grant from the Texas Instruments Community Fund, an advised fund of Silicon Valley Community Foundation. 3

