Fig. 7. - 2016 Fall Meeting
advertisement
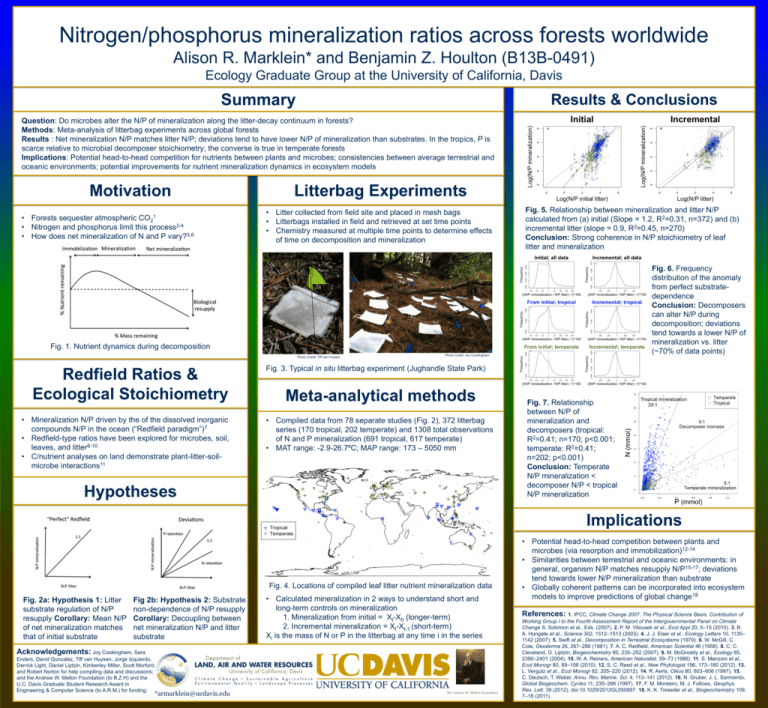
Nitrogen/phosphorus mineralization ratios across forests worldwide Alison R. Marklein* and Benjamin Z. Houlton (B13B-0491) Ecology Graduate Group at the University of California, Davis Summary Results & Conclusions Question: Do microbes alter the N/P of mineralization along the litter-decay continuum in forests? Methods: Meta-analysis of litterbag experiments across global forests Results : Net mineralization N/P matches litter N/P; deviations tend to have lower N/P of mineralization than substrates. In the tropics, P is scarce relative to microbial decomposer stoichiometry; the converse is true in temperate forests Implications: Potential head-to-head competition for nutrients between plants and microbes; consistencies between average terrestrial and oceanic environments; potential improvements for nutrient mineralization dynamics in ecosystem models Motivation • Forests sequester atmospheric CO21 • Nitrogen and phosphorus limit this process2-4 • How does net mineralization of N and P vary?5,6 Litterbag Experiments • Litter collected from field site and placed in mesh bags • Litterbags installed in field and retrieved at set time points • Chemistry measured at multiple time points to determine effects of time on decomposition and mineralization Fig. 1. Nutrient dynamics during decomposition Photo Credit: Tiff van Huysen Redfield Ratios & Ecological Stoichiometry • Mineralization N/P driven by the of the dissolved inorganic compounds N/P in the ocean (“Redfield paradigm”)7 • Redfield-type ratios have been explored for microbes, soil, leaves, and litter8-10 • C/nutrient analyses on land demonstrate plant-litter-soilmicrobe interactions11 Photo Credit: Joy Cookingham Fig. 5. Relationship between mineralization and litter N/P calculated from (a) initial (Slope = 1.2, R2=0.31, n=372) and (b) incremental litter (slope = 0.9, R2=0.45, n=270) Conclusion: Strong coherence in N/P stoichiometry of leaf litter and mineralization Fig. 6. Frequency distribution of the anomaly from perfect substratedependence Conclusion: Decomposers can alter N/P during decomposition; deviations tend towards a lower N/P of mineralization vs. litter (~70% of data points) Fig. 3. Typical in situ litterbag experiment (Jughandle State Park) Meta-analytical methods • Compiled data from 78 separate studies (Fig. 2), 372 litterbag series (170 tropical, 202 temperate) and 1308 total observations of N and P mineralization (691 tropical, 617 temperate) • MAT range: -2.9-26.7ºC; MAP range: 173 – 5050 mm Hypotheses Fig. 7. Relationship between N/P of mineralization and decomposers (tropical: R2=0.41; n=170; p<0.001; temperate: R2=0.41; n=202; p<0.001) Conclusion: Temperate N/P mineralization < N/Pdecomposer min. Tropics > tropical N/P microbes > N/P min. Temperate N/P < N/P mineralization Implications Fig. 4. Locations of compiled leaf litter nutrient mineralization data Fig. 2a: Hypothesis 1: Litter substrate regulation of N/P resupply Corollary: Mean N/P of net mineralization matches that of initial substrate Fig 2b: Hypothesis 2: Substrate non-dependence of N/P resupply Corollary: Decoupling between net mineralization N/P and litter substrate Acknowledgements: Joy Cookingham, Sara Enders, David Gonzalez, Tiff van Huysen, Jorge Izquierdo, Derrick Light, Daniel Liptzin, Kimberley Miller, Scott Morford, and Robert Norton for help compiling data and discussions; and the Andrew W. Mellon Foundation (to B.Z.H) and the U.C. Davis Graduate Student Research Award in Engineering & Computer Science (to A.R.M.) for funding. *armarklein@ucdavis.edu • Calculated mineralization in 2 ways to understand short and long-term controls on mineralization 1. Mineralization from initial = Xt-X0 (longer-term) 2. Incremental mineralization = Xt-Xt-1 (short-term) Xi is the mass of N or P in the litterbag at any time i in the series • Potential head-to-head competition between plants and microbes (via resorption and immobilization)12-14 • Similarities between terrestrial and oceanic environments: in general, organism N/P matches resupply N/P15-17; deviations tend towards lower N/P mineralization than substrate • Globally coherent patterns can be incorporated into ecosystem models to improve predictions of global change18 References: 1. IPCC, Climate Change 2007: The Physical Science Basis. Contribution of Working Group I to the Fourth Assessment Report of the Intergovernmental Panel on Climate Change S. Solomon et al., Eds. (2007). 2. P. M. Vitousek et al., Ecol Appl 20, 5–15 (2010). 3. B. A. Hungate et al., Science 302, 1512–1513 (2003). 4. J. J. Elser et al., Ecology Letters 10, 1135– 1142 (2007). 5. Swift et al., Decomposition in Terrestrial Ecosystems (1979). 6. W. McGill, C. Cole, Geoderma 26, 267–286 (1981). 7. A. C. Redfield, American Scientist 46 (1958). 8. C. C. Cleveland, D. Liptzin, Biogeochemistry 85, 235–252 (2007). 9. M. McGroddy et al., Ecology 85, 2390–2401 (2004). 10. W. A. Reiners, American Naturalist, 59–73 (1986). 11. S. Manzoni et al., Ecol Monogr 80, 89–106 (2010). 12. S. C. Reed et al., New Phytologist 196, 173–180 (2012). 13. L. Vergutz et al., Ecol Monogr 82, 205–220 (2012). 14. R. Aerts, Oikos 80, 603–606 (1997). 15. C. Deutsch, T. Weber, Annu. Rev. Marine. Sci. 4, 113–141 (2012). 16. N. Gruber, J. L. Sarmiento, Global Biogeochem. Cycles 11, 235–266 (1997). 17. F. M. Monteiro, M. J. Follows, Geophys. Res. Lett. 39 (2012), doi:10.1029/2012GL050897. 18. K. K. Treseder et al., Biogeochemistry 109, 7–18 (2011).
