Dowload File
advertisement
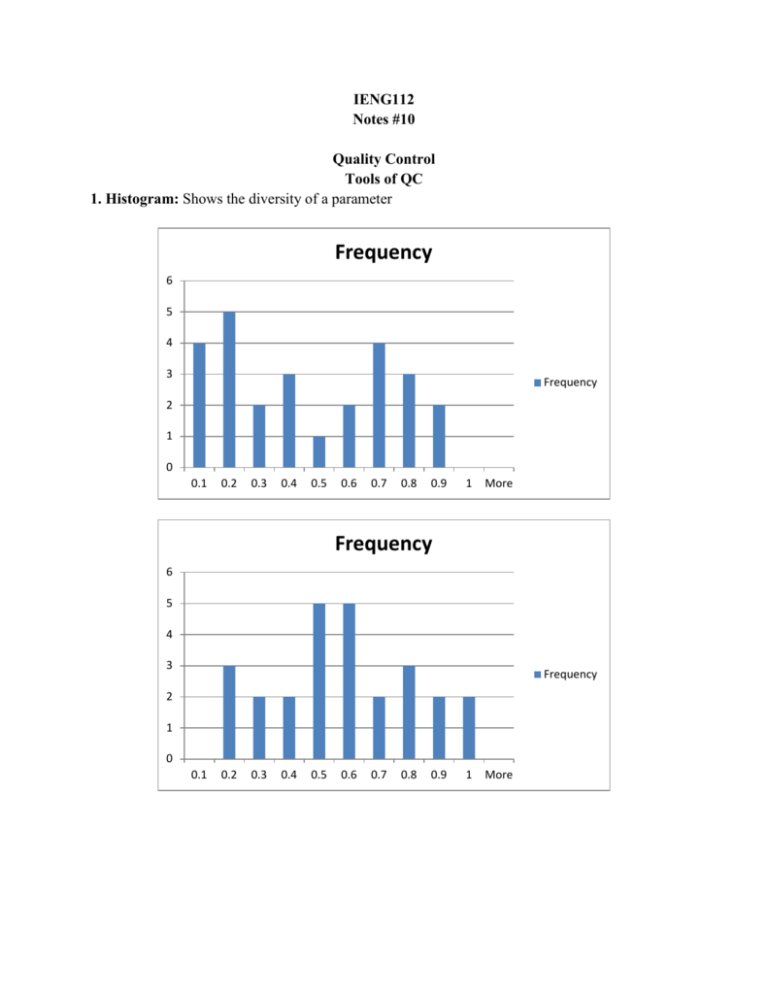
IENG112 Notes #10 Quality Control Tools of QC 1. Histogram: Shows the diversity of a parameter Frequency 6 5 4 3 Frequency 2 1 0 0.1 0.2 0.3 0.4 0.5 0.6 0.7 0.8 0.9 1 More Frequency 6 5 4 3 Frequency 2 1 0 0.1 0.2 0.3 0.4 0.5 0.6 0.7 0.8 0.9 1 More Frequency 9 8 7 6 5 Frequency 4 3 2 1 0 0.7 0.5 0.6 0.8 0.4 0.2 0.3 1 0.1 0.9 More 2. Pareto Analysis: Shows frequency/importance of errors Error A B C D E F G H I J K L Frequency Percentage 7 3 3 3 2 2 1 1 1 1 1 1 26.9230769 11.5384615 11.5384615 11.5384615 7.69230769 7.69230769 3.84615385 3.84615385 3.84615385 3.84615385 3.84615385 3.84615385 Total Percentage 26.9230769 38.4615385 50 61.5384615 69.2307692 76.9230769 80.7692308 84.6153846 88.4615385 92.3076923 96.1538462 100 Frequency L K J I H G F E D C B A Frequency 0 2 4 6 8 The logic of Pareto Analysis is the same as of ABC analysis. First, concern is paid to the errors giving the first 80 percent. “Vilfredo Federico Damaso Pareto (born Wilfried Fritz Pareto; Italian: 15 July 1848 – 19 August 1923) was an Italian engineer, sociologist, economist, political scientist and philosopher. He made several important contributions to economics, particularly in the study of income distribution and in the analysis of individuals' choices.” Wikipedia Measures which can be used in Pareto analysis: number of defects, number of breakdowns, (total) length of the breakdowns. 3. Scatter Plot: Shows relation between measured quantities. Cooling Time (hours) 40.00 38.00 36.00 34.00 32.00 30.00 28.00 26.00 24.00 22.00 20.00 y = 0.0978x - 22.362 R² = 0.8954 Cooling Time (hours) Linear (Cooling Time (hours)) 440 490 540 590 Cooling Time (hours) 40.00 38.00 36.00 34.00 32.00 30.00 28.00 26.00 24.00 22.00 20.00 y = 0.1071x - 27.286 R² = 0.9071 Cooling Time (hours) Linear (Cooling Time (hours)) 440 490 540 590 Cause-and-Effect Relationship: What is cause, what is effect? Are both of them effects? 4. Cause-and-Effect Diagram/Fishbone Diagram/Ishikawa Diagram: useful in locating the defect. Use team to build Brainstorming: potential causes of defects, evaluation later. The problem (statement) must be measurable. 3 to 6 main categories. For each main categories the list of causes are on subbones or sub-subbones. Selection of most important causes: o Repeated items. Identification. o Discuss each cause and use “expert knowledge”. o Team consensus for the importance of causes. o Up-date. 5. Flowchart. (Already mentioned in the discussion of technology: omelet basic.) Decisions and actions. Instruction in the case of defect.


