toycarsLesson Guide
advertisement
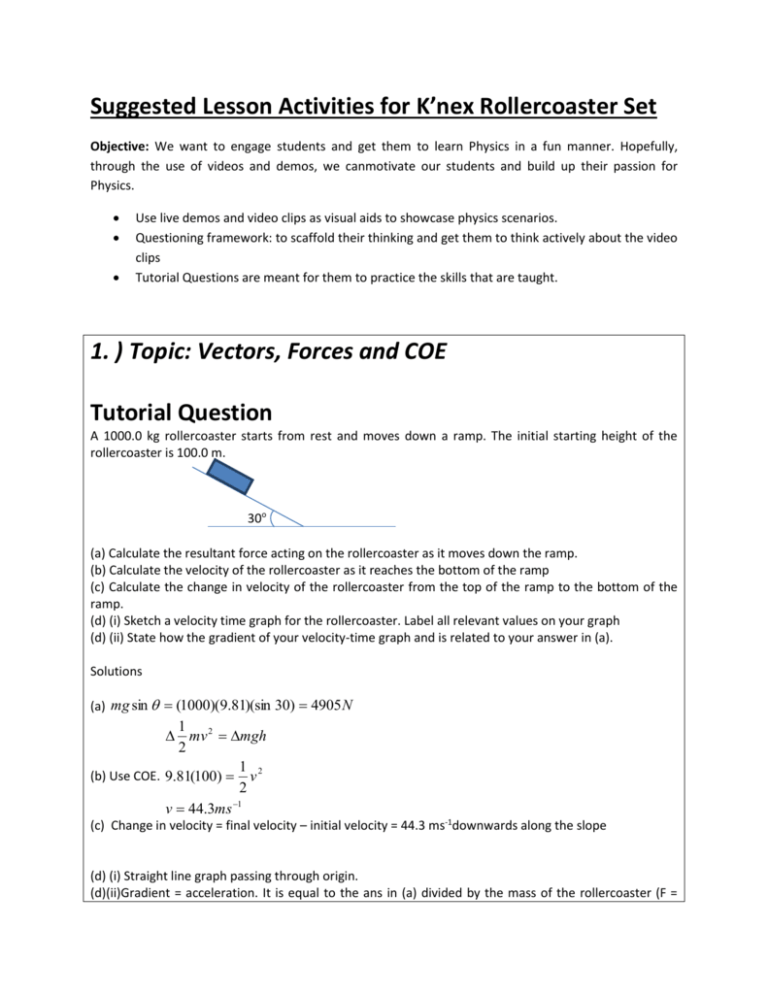
Suggested Lesson Activities for K’nex Rollercoaster Set Objective: We want to engage students and get them to learn Physics in a fun manner. Hopefully, through the use of videos and demos, we canmotivate our students and build up their passion for Physics. Use live demos and video clips as visual aids to showcase physics scenarios. Questioning framework: to scaffold their thinking and get them to think actively about the video clips Tutorial Questions are meant for them to practice the skills that are taught. 1. ) Topic: Vectors, Forces and COE Tutorial Question A 1000.0 kg rollercoaster starts from rest and moves down a ramp. The initial starting height of the rollercoaster is 100.0 m. 30o (a) Calculate the resultant force acting on the rollercoaster as it moves down the ramp. (b) Calculate the velocity of the rollercoaster as it reaches the bottom of the ramp (c) Calculate the change in velocity of the rollercoaster from the top of the ramp to the bottom of the ramp. (d) (i) Sketch a velocity time graph for the rollercoaster. Label all relevant values on your graph (d) (ii) State how the gradient of your velocity-time graph and is related to your answer in (a). Solutions (a) mg sin (1000)(9.81)(sin 30) 4905 N 1 mv 2 mgh 2 1 (b) Use COE. 9.81(100) v 2 2 1 v 44.3ms (c) Change in velocity = final velocity – initial velocity = 44.3 ms-1downwards along the slope (d) (i) Straight line graph passing through origin. (d)(ii)Gradient = acceleration. It is equal to the ans in (a) divided by the mass of the rollercoaster (F = ma). Questioning Framework Use video clips from the folder “1 Straight Ramp” Use whatever questions here that you find useful. The idea here is not to tell students the answers, but to ask them guiding questions to force them to think instead of passively accepting and copying down answers only. What do you notice about the length of the arrow? It increases. What do you think the arrow represents? Velocity When the rollercoaster is very high up, what type of energy does it have? Gravitational Potential Energy As the rollercoaster goes all the way down, what happens to the GPE? Does it get converted into something else? KE Can you write an equation for me linking the GPE and the KE? Popular Misconception: It is the change in GPE that is equal to the change in KE, and not GPE = KE. Correct the students if they make this misconception. Why do you think the length of the arrow increases? Due to C.O.E. from GPE to KE. Higher KE implies greater speed. Where is the point where gravitational potential energy is taken to be zero? At the top of the ramp or the bottom of the ramp? Either one works. Reinforce the idea to them that we can use different reference points and we can set GPE = 0 to a place where it is convenient for us. Is there a resultantforce acting on the object in this case? What tells us that? There is a net force as the magnitude of the velocity increases. According to Newton’s second law, there must be a resultant force as there is change in velocity. What is a net force? Describe it in your own words for me If need be, draw some random forces and ask them to express graphically what is the net force. Students need to know how to use the polygon method of finding the resultant force. Student work in pairs: Can you draw a FBD on the rollercoaster? Key Learning Points for drawing Weight Vector Arrow Pay special attention to the mistake below, where students have the resolved component longer than the actual vector itself. Go slowly and teach students how that the component along the slope is Mg sin Some students may not be able to identify the angle . May need to draw a detailed trigo diagram for them. For beginners, make sure that we start them off with the correct habits. o Write Weight instead of W. o Get them to write which bodies exert forces on which body. Example: Weightby Earth on Rollercoaster. This will be very useful later on when teaching them Newton’s 3rd Law and also when questions get more difficult. From your free body diagram, can you show me how you get the net force on the object? Use two methods: the vector triangle method and also the “resolving of weight along ramp” method to get the net force. Hard Question. In this case, the force and the direction of motion are the same. Is this always true? No. Prove that this is false by counterexample. The easiest example is to throw a marker upwards. It moves up, but net force (gravity) acts downwards. 2. Topic: Vectors, COE and Kinematics Two ramps are shown below. Both the ramps have the same height. (a) Which ramp will allow the ball to reach the bottom the fastest? What relevant Physics concepts can you use to explain the rationale for your choice? Please work out this answer without reading the rest of the question first. Ramp B (b) Draw in a vector arrow representing the velocity of the ball when it is: (b) (i) at Points A1, A2 and A3 on Ramp A (b) (ii) at Points B1, B2 and B3 on Ramp B. Ramp A (b) (iii) Draw a vector triangle showing how the change in velocity of the ball from A2 to A3can be determined. (c) The graph below shows the actual displacement of the balls. Each marker represents the position of the ball at intervals of every 1 3 of a second shown in the slow motion video. 160 Graph 1: Displacement Graph for Ramp A and Ramp B 140 Horizontal Displacment / cm 120 100 80 60 40 20 0 0 20 40 60 80 100 120 140 Horizontal Displacement / cm Ramp A Ramp B (c) Using Graph 1, estimate the time taken for the ball: (c)(i) to reach the bottom of Ramp A and Ramp B in the slow-motion video. (c)(ii) to reach the middle of Ramp A and Ramp B in the slow-motion video. (d) Explain how a velocity - time graph can be derived from Graph 1 (e)(i) Graph 2 shows a velocity time graph for Ramp A and Ramp B. Identify which graph belongs to Ramp A and Ramp B. Explain the reasons for your choice. 60 Graph 2: Velocity-time graph for Ramp A and Ramp B 50 Velocity (cm/s) 40 30 20 10 0 0 2 4 6 8 10 Time in slow motion video / s (e)(ii)Using Graph 2, estimate the distance travelled by ball for Ramp A. (e) (iii) Using Graph 2, estimate the average acceleration of the ball in the slow motion video for Ramp A. Solutions: (a) The one with the higher average speed will reach faster. It is only possible to work out this answer by looking at the actual data itself, which is done in the subsequent parts of the question. (b) (i) Key points are: Velocity at A3 is same as B3 Velocity at B2 must be higher than A2. (b)(iii) Use change in velocity = final velocity – initial velocity (c) Count the number of dots there are. Each dot represents 1/3 of a second. Ramp A: 16 dots ( 5.3 seconds) Ramp B: 26 dots (8.7 seconds) (d) For the time, we can count the dots. For the velocity, we can use conservation of energy by using mgh 1 2 mv 2 (e)(i) The blue diamond-shaped graph is for Ramp A. This is because the speed is higher than the other graph at the start. This higher speed is due to a larger acceleration as Ramp A is more steep. (e)(ii) Need to estimate the area under the graph. My estimate is about 208 cm. (e)(iii). There are many possible ways of solving this. Accept any reasonable method that is logical: You can use: total velocity divide by time. Or add up all the velocities and divide by the total number of values. Or try to fit in a gradient to the velocity-time graph. My estimate is 0.0674 ms-2. 3. Topic: Impulse A group of experimentersare conducting a study on how to improve the safety of rollercoasters. A 100 kg rollercoaster is released down a ramp and it crashes into a wall as shown below. Wall In Case 1, the rollercoaster crashes into a hard wall made of reinforced concrete. In Case 2, the rollercoaster crashes into a soft wall made of an absorbent material. The graphs below show the velocity against time for Case 1 and Case 2. Graph 1: Soft Wall 40.0 Velocity / ms-1 30.0 20.0 10.0 0.0 0.0 2.0 4.0 6.0 -10.0 -20.0 Time / x 10-1 s 8.0 10.0 Graph 2: Hard Wall 40.0 Velocity / ms-1 30.0 20.0 10.0 0.0 -10.0 0.0 0.5 1.0 1.5 2.0 2.5 3.0 3.5 -20.0 -30.0 Time / x 10-1 s (a) Estimate the change in momentum of the rollercoaster in both cases (b) Using your answer in (a) , calculate the average force on each of the rollercoaster cars. (c) In practice, cars have a structural feature called a crumple zone in the front of the car. This crumple zone is made up of an easily deformed metal and is meant to enhance safety. Using your answers in (a) and (b), explain how a crumple zone helps to improve safety during car accidents. Solutions: (a) For Case 1, change in momentum = 100 (26 – 2) = 2400 kgms-1 For Case 2, change in momentum = 100 (26 – (-19) = 4500 kgms-1 (b) Impulse = change in momentum = Faverage x time. For Case 1, 2400 = Faverage x (9.5 – 3.5)= 400 N For Case 2, 4500 = Faveragex (1.35-1.20) = 4060 N (c) Crumple zone helps to lengthen the duration of the collision, and hence reduces the average force acting on the object. Learning Points When going down the ramp, Force is constant (it is Mg sin ) When hitting the wall, the Force is in the opposite direction and also very large. o A large force is needed to produce a large acceleration o The acceleration needed to stop the rollercoaster is large because its velocity is brought to rest in a short period of time. i.e. v is large t Comparing the cotton wall and the hard wall, the difference is that the duration of collision for the cotton wall is longer as there is a cushioning effect. Hence, the average force is smaller. Introduce the idea of F m o o o v to students. Get them to go through a few other examples. t Boxer and golfers following through on their strikes so as to ensure a larger force A rifle with a longer barrel can shoot over a longer distance Lab Demo: Use a blow gun (empty PVC pipe and nerf dart) to show that the longer the blow gun, the further the dart will travel.
