Supply and Demand Interactive Graphing
advertisement
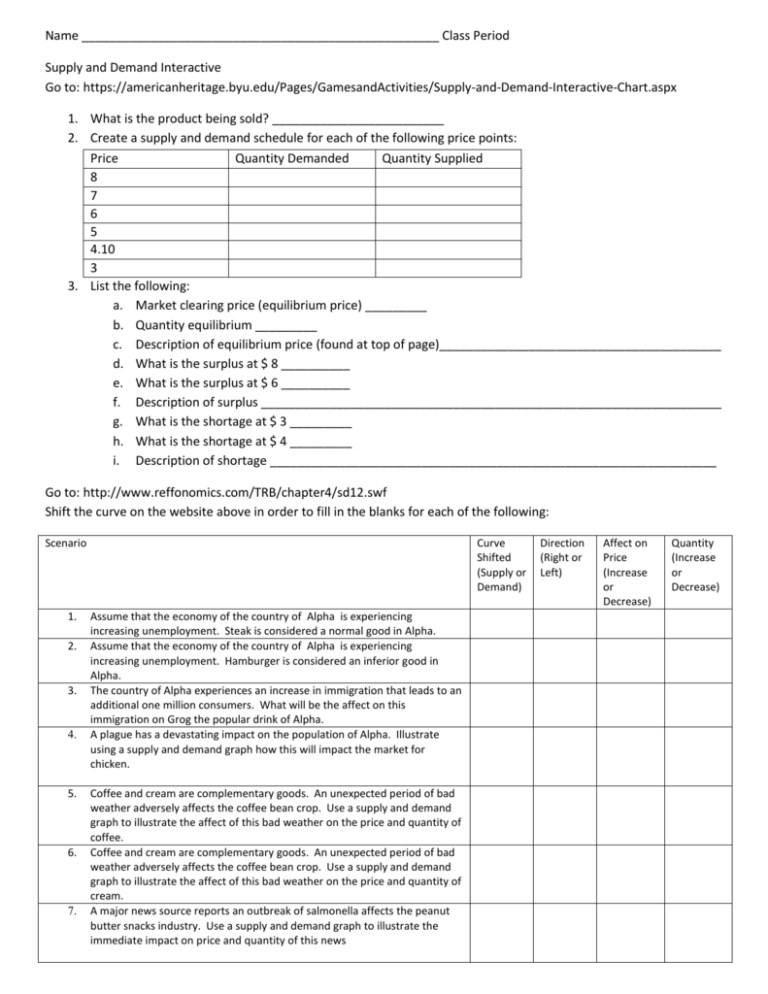
Name ____________________________________________________ Class Period Supply and Demand Interactive Go to: https://americanheritage.byu.edu/Pages/GamesandActivities/Supply-and-Demand-Interactive-Chart.aspx 1. What is the product being sold? _________________________ 2. Create a supply and demand schedule for each of the following price points: Price Quantity Demanded Quantity Supplied 8 7 6 5 4.10 3 3. List the following: a. Market clearing price (equilibrium price) _________ b. Quantity equilibrium _________ c. Description of equilibrium price (found at top of page)_________________________________________ d. What is the surplus at $ 8 __________ e. What is the surplus at $ 6 __________ f. Description of surplus ___________________________________________________________________ g. What is the shortage at $ 3 _________ h. What is the shortage at $ 4 _________ i. Description of shortage _________________________________________________________________ Go to: http://www.reffonomics.com/TRB/chapter4/sd12.swf Shift the curve on the website above in order to fill in the blanks for each of the following: Scenario 1. 2. 3. 4. 5. 6. 7. Curve Shifted (Supply or Demand) Assume that the economy of the country of Alpha is experiencing increasing unemployment. Steak is considered a normal good in Alpha. Assume that the economy of the country of Alpha is experiencing increasing unemployment. Hamburger is considered an inferior good in Alpha. The country of Alpha experiences an increase in immigration that leads to an additional one million consumers. What will be the affect on this immigration on Grog the popular drink of Alpha. A plague has a devastating impact on the population of Alpha. Illustrate using a supply and demand graph how this will impact the market for chicken. Coffee and cream are complementary goods. An unexpected period of bad weather adversely affects the coffee bean crop. Use a supply and demand graph to illustrate the affect of this bad weather on the price and quantity of coffee. Coffee and cream are complementary goods. An unexpected period of bad weather adversely affects the coffee bean crop. Use a supply and demand graph to illustrate the affect of this bad weather on the price and quantity of cream. A major news source reports an outbreak of salmonella affects the peanut butter snacks industry. Use a supply and demand graph to illustrate the immediate impact on price and quantity of this news Direction (Right or Left) Affect on Price (Increase or Decrease) Quantity (Increase or Decrease) Go to: http://www.reffonomics.com/TRB/chapter4/qs-qd5.swf Scenario 1: The government now sets an effective price above the equilibrium price to a price of p4. 1. Is the price of p4 that is set by the government above the equilibrium price a price floor or price ceiling? 2. At a price of p4 will there be a shortage or surplus? Scenario 2: The government now sets an effective price below the equilibrium price to a price of p1. 1. Is the price of p4 that is set by the government above the equilibrium price a price floor or price ceiling? 2. At a price of p4 will there be a shortage or surplus?

