2007 CWI Presentation - Foundation for Child Development
advertisement
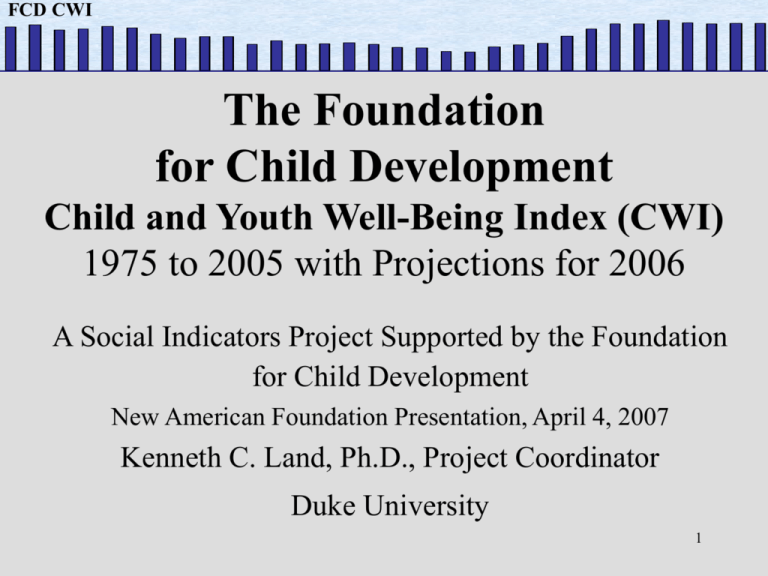
FCD CWI FCD CWI The Foundation for Child Development Child and Youth Well-Being Index (CWI) 1975 to 2005 with Projections for 2006 A Social Indicators Project Supported by the Foundation for Child Development New American Foundation Presentation, April 4, 2007 Kenneth C. Land, Ph.D., Project Coordinator Duke University 1 FCD CWI FCD CWI What is the CWI? • It is a composite measure of trends in the quality of life, or well-being, of America’s children and young people since 1975. • It consists of 28 social indicators organized in seven quality-of-life domains. 2 FCD CWI FCD CWI What Does the CWI Tell Us? • Did overall child and youth well-being in the United States improve or deteriorate over the last two generations? • By how much? • In which domains or areas of social life? • For which age groups? • For boys and girls equally? • For which racial and ethnic groups? • Did disparities between groups increase or decrease? 3 FCD CWI FCD CWI Methods of CWI Construction • The CWI places 28 national level indicators into seven quality-of-life domains – – – – – – – Family Economic Well-Being Health Safety/Behavioral Concerns Educational Attainment Community Connectedness Social Relationships (with Family and Peers) Emotional/Spiritual Well-Being 4 FCD CWI FCD CWI • Each of the 28 indicators uses annual time series data from vital statistics and sample surveys • Each indicator is indexed by percentage change from the base year, 1975. • The base year is assigned a value of 100. – A value greater than 100 in subsequent years means the social condition measured has improved. A value less than 100 means the social condition has deteriorated. 5 FCD CWI FCD CWI • The 28 indicators are grouped together into seven domains to construct domain-specific summary well-being indices. – Within these summary indices, each indicator is equally weighted. • The seven domain indices are combined into the Child and Youth Well-being Index (CWI). – Each domain is equally weighted in the construction of the CWI. 6 FCD CWI FCD CWI Composite Index of Child and Youth Well-Being 7 FCD CWI FCD CWI Figure 1: Child Well-Being Index, 1975-2005, with Projections for 2006 110 100 95 90 Year 20 05 20 03 20 01 19 99 19 97 19 95 19 93 19 91 19 89 19 87 19 85 19 83 19 81 19 79 19 77 85 19 75 Percent of Base Year 105 8 FCD CWI FCD CWI Domain-Specific Indices 9 FCD CWI FCD CWI Figure 2. Domain-Specific Summary Indices, 1975-2005, with Projections for 2006. 150 Family Economic Well-Being Health 140 Safety/Behavioral Concerns Educational Attainment Community Connectedness 130 Social Relationships Emotional/Spiritual Well-Being 110 100 90 80 70 Year 20 05 20 03 20 01 19 99 19 97 19 95 19 93 19 91 19 89 19 87 19 85 19 83 19 81 19 79 19 77 60 19 75 Percent of Base Year 120 10 FCD CWI FCD CWI Trends in Child and Youth Well-Being by Race and Ethnicity 11 FCD CWI FCD CWI Figure 3. Total and Race/Ethnic-Group Summary CWIs as a Percent of Total CWI for all Children and Youth at Base Year, 1985-2005 120 White African American Hispanic 110 Total CWI 105 100 95 90 85 80 75 Year 20 05 20 04 20 03 20 02 20 01 20 00 19 99 19 98 19 97 19 96 19 95 19 94 19 93 19 92 19 91 19 90 19 89 19 88 19 87 19 86 70 19 85 Percent of Base Year for All Children and Youth 115 12 FCD CWI FCD CWI Figure 3a. Suicide Rates, Ages 15-19, 1985-2005. 14 White Suicide Rates Black Suicide Rates Hispanic Suicide Rates 10 8 6 4 Year 20 05 20 04 20 03 20 02 20 01 20 00 19 99 19 98 19 97 19 96 19 95 19 94 19 93 19 92 19 91 19 90 19 89 19 88 19 87 19 86 2 19 85 Deaths per 100,000 12 13 FCD CWI FCD CWI Figure 3b. Rates of Cigarette Smoking Prevalence in the Past 30 Days, Grades 12, 10, and 8, 1985 (or 1992)-2005. 55 50 45 White 12th Graders Black 12th Graders Hispanic 12th Graders White 10th Graders Black 10th Graders Hispanic 10th Graders White 8th Graders Black 8th Graders Hispanic 8th Graders 40 30 25 20 15 10 5 Year 20 05 20 04 20 03 20 02 20 01 20 00 19 99 19 98 19 97 19 96 19 95 19 94 19 93 19 92 19 91 19 90 19 89 19 88 19 87 19 86 0 19 85 Percent 35 14 FCD CWI FCD CWI Figure 3c. Median Family Incomes for Families with Children in 2005 Dollars, 1987-2005. 90,000 White Median Income for Families with Children 0-17 80,000 Black Median Income for Families with Children 0-17 Hispanic Median Income for Families with Children 0-17 60,000 50,000 40,000 30,000 Year 20 05 20 04 20 03 20 02 20 01 20 00 19 99 19 98 19 97 19 96 19 95 19 94 19 93 19 92 19 91 19 90 19 89 19 88 20,000 19 87 Year 2005 Dollars 70,000 15 FCD CWI FCD CWI Figure 4. Race/Ethnic Group-Specific Summary Indices of Child and Youth Well Being, 1985-2005 115 White Black Hispanic 105 100 95 Year 05 20 04 20 03 20 02 20 01 20 00 20 99 19 98 19 97 19 96 19 95 19 94 19 93 19 92 19 91 19 90 19 89 19 88 19 87 19 86 19 85 90 19 Percent of Group's Base Year 110 16 FCD CWI FCD CWI Conclusions The CWI shows that children and youth in the United States are doing slightly better today than in 1975. But, progress in child and youth well-being has stalled. The gap in overall quality of life between white, African American, and Hispanic children narrowed between the mid-90s and 2002. That progress, too, has stalled. Disparities among the groups remain. We are doing better in areas of social life that reflect cultural values and over which parents and community institutions can exercise some influence and control. America’s children are doing less well in areas that have to do with policy and the role of government. 17 FCD CWI FCD CWI The CWI on the Web: http://www.soc.duke.edu/~cwi/ 18
