Valuation 5e
advertisement
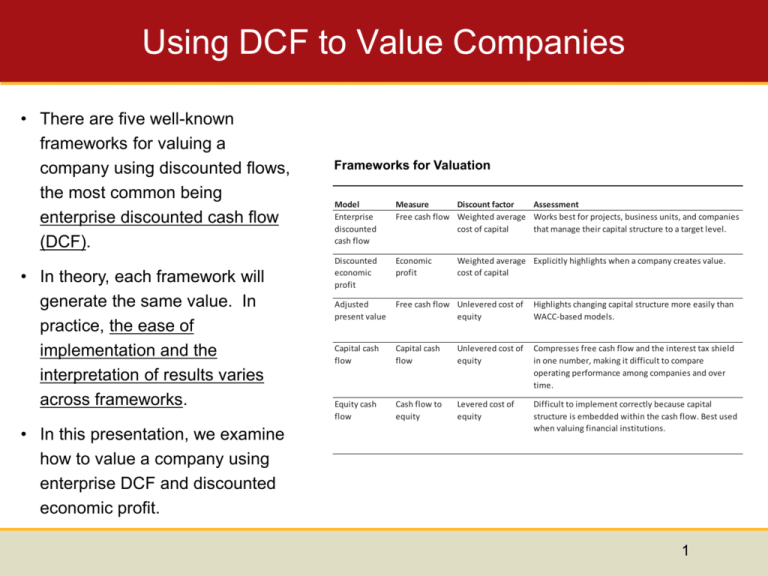
Using DCF to Value Companies • There are five well-known frameworks for valuing a company using discounted flows, the most common being enterprise discounted cash flow (DCF). • In theory, each framework will generate the same value. In practice, the ease of implementation and the interpretation of results varies across frameworks. • In this presentation, we examine how to value a company using enterprise DCF and discounted economic profit. Frameworks for Valuation Model Enterprise discounted cash flow Measure Discount factor Assessment Free cash flow Weighted average Works best for projects, business units, and companies cost of capital that manage their capital structure to a target level. Discounted economic profit Economic profit Adjusted present value Free cash flow Unlevered cost of equity Highlights changing capital structure more easily than WACC-based models. Capital cash flow Capital cash flow Unlevered cost of equity Compresses free cash flow and the interest tax shield in one number, making it difficult to compare operating performance among companies and over time. Equity cash flow Cash flow to equity Levered cost of equity Difficult to implement correctly because capital structure is embedded within the cash flow. Best used when valuing financial institutions. Weighted average Explicitly highlights when a company creates value. cost of capital 1 Valuing the Enterprise versus Financial Claims • To value a company, you can either value the cash flows generated by the company’s economic assets or value each financial claim separately (debt equity, other financial claims, etc.). Enterprise Valuation of a Single-Business Company $ million 427.5 After-tax cash flow to debt holders 427.5 Debt value 1 110 Free cash flow To value operations, discount free cash flow by the weighted average cost of capital. 70 20 180 140 110 100 65 200.0 15 120 Cash flow to equity holders Equity value To value equity directly, discount equity cash flow by the cost of equity. 227.5 90 Discount free cash flow by the weighted average cost of capital. 70 85 55 70 Enterprise value 1 Alternatively, value operations and subtract the value of debt. Debt value equals discounted after-tax cash flow to debt holders plus the present value of interest tax shield . 2 Economic Profit Valuation Models Frameworks for Valuation • The economic profit model highlights how and when the company creates value yet leads to a valuation that is identical to that of enterprise DCF. • Economic profit can be used to measure a company’s performance in a given year. This allows you to determine when value is being created. Model Enterprise discounted cash flow Measure Discount factor Assessment Free cash flow Weighted average Works best for projects, business units, and companies cost of capital that manage their capital structure to a target level. Discounted economic profit Economic profit Adjusted present value Free cash flow Unlevered cost of equity Highlights changing capital structure more easily than WACC-based models. Capital cash flow Capital cash flow Unlevered cost of equity Compresses free cash flow and the interest tax shield in one number, making it difficult to compare operating performance among companies and over time. Equity cash flow Cash flow to equity Levered cost of equity Difficult to implement correctly because capital structure is embedded within the cash flow. Best used when valuing financial institutions. Weighted average Explicitly highlights when a company creates value. cost of capital 3 Defining Economic Profit • Economic profit translates size, return on capital, and cost of capital into a single measure. Economic profit equals the spread between the return on invested capital and the cost of capital times the amount of invested capital. Economic Profit = Invested Capital × (ROIC – WACC) • The formula for economic profit can be rearranged and defined as after-tax operating profits less a charge for the capital used by the company: Economic Profit = NOPLAT − (Invested Capital × WACC) • This approach shows that economic profit is similar in concept to accounting net income, but it explicitly charges a company for all its capital, not just the interest on its debt. 4 Economic Profit at Home Depot • Consider both measures of economic profit for Home Depot. Since Home Depot had been earning returns greater than its cost of capital, its historical economic profit was positive. Following the financial crisis in 2008, this was no longer the case. • Not every company has a positive economic profit. In fact, many companies earn an accounting profit (net income greater than zero), but can’t earn their cost of capital. Home Depot: Economic Profit Valuation $ million Method 1 Return on invested capital Weighted average cost of capital Economic spread × Invested capital Historical 2006 15.9% 8.4% 7.5% 2007 9.6% 8.2% 1.4% 2008 7.9% 8.3% −0.4% Forecast 2009 8.0% 8.5% −0.4% 2010 9.6% 8.5% 1.1% 2011 10.8% 8.5% 2.3% Economic profit 39,389 2,950 46,543 629 38,567 (162) 37,075 (164) 34,137 383 35,038 818 Method 2 Invested capital (beginning of year) × Weighted average cost of capital Capital charge 39,389 8.4% 3,295 46,543 8.2% 3,827 38,567 8.3% 3,195 37,075 8.5% 3,135 34,137 8.5% 2,886 35,038 8.5% 2,962 NOPLAT Capital charge Economic profit 6,245 (3,295) 2,950 4,456 (3,827) 629 3,033 (3,195) (162) 2,971 (3,135) (164) 3,269 (2,886) 383 3,780 (2,962) 818 5 Discounted Economic Profit Leads to Same Results as DCF • To demonstrate how economic profit can be used to value a company—and to demonstrate its equivalence to enterprise DCF—consider a stream of growing cash flows valued using the growing perpetuity formula, Value 0 FCF1 WACC g • Using a few algebraic transformations and the assumption that the company’s ROIC on new projects equals the company’s current ROIC, we can transform the cash flow perpetuity into an economic-profit-based key value driver model, Value 0 Invested Capital 0 Invested Capital 0 ROIC WACC WACC g • Substituting the definition of economic profit, Value 0 Invested Capital 0 Economic Profit 1 WACC g 6 Home Depot: Economic Profit Valuation Home Depot: Economic Profit Valuation Invested capital1 ($ million) 37,075 34,137 35,038 36,897 38,900 40,821 42,748 44,665 46,568 48,453 Year 2009 2010 2011 2012 2013 2014 2015 2016 2017 2018 Continuing value Present value of economic profit ROIC1 (percent) 8.0 9.6 10.8 11.6 12.3 12.3 12.2 12.2 12.2 12.1 WACC (percent) 8.5 8.5 8.5 8.5 8.5 8.5 8.5 8.5 8.5 8.5 Economic profit ($ million) (164) 383 818 1,145 1,487 1,550 1,611 1,671 1,731 1,789 41,922 Discount factor (@ 8.5%) 0.922 0.850 0.784 0.723 0.666 0.614 0.567 0.522 0.482 0.444 0.444 Present value of economic profit ($ million) (151) 325 641 827 991 952 913 873 834 795 18,619 25,619 Invested capital in 2008 Invested capital plus present value of economic profit 37,075 62,694 Midyear adjustment factor Value of operations 1.041 65,291 1Invested Valuation using economic profit leads to the same value as enterprise DCF! The value of operations equals: the sum of discounted economic profit + current invested capital capital is measured at the beginning of the year. 7
