Lab Report Physics Centripetal Acceleration Arisara Kenute Now 10
advertisement
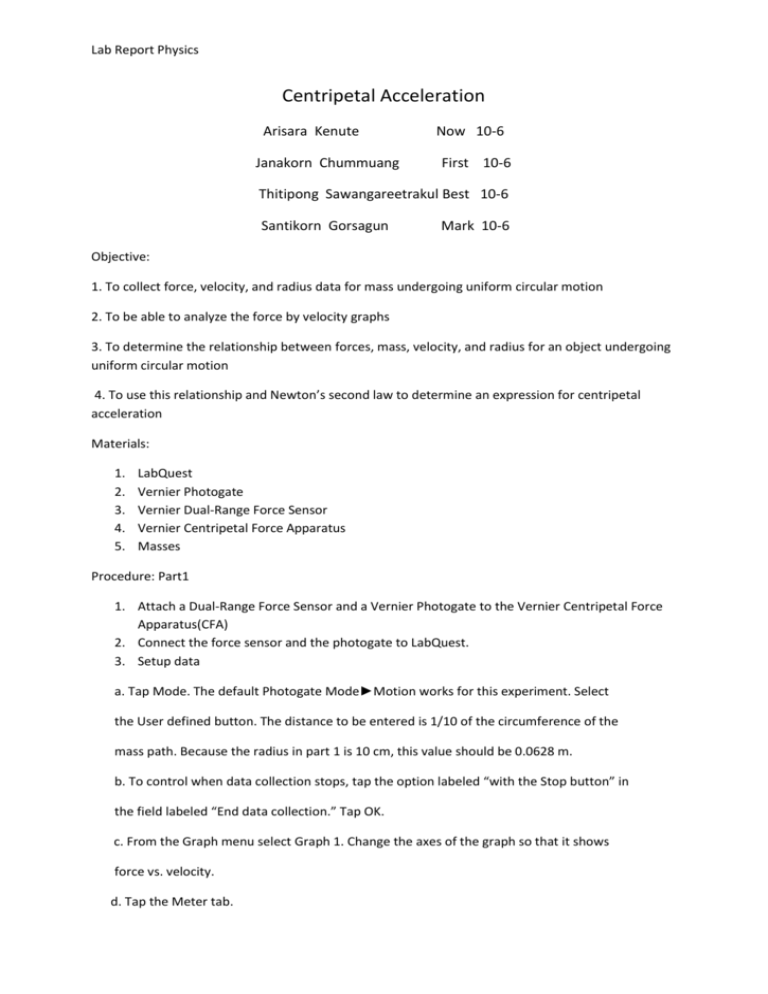
Lab Report Physics Centripetal Acceleration Arisara Kenute Janakorn Chummuang Now 10-6 First 10-6 Thitipong Sawangareetrakul Best 10-6 Santikorn Gorsagun Mark 10-6 Objective: 1. To collect force, velocity, and radius data for mass undergoing uniform circular motion 2. To be able to analyze the force by velocity graphs 3. To determine the relationship between forces, mass, velocity, and radius for an object undergoing uniform circular motion 4. To use this relationship and Newton’s second law to determine an expression for centripetal acceleration Materials: 1. 2. 3. 4. 5. LabQuest Vernier Photogate Vernier Dual-Range Force Sensor Vernier Centripetal Force Apparatus Masses Procedure: Part1 1. Attach a Dual-Range Force Sensor and a Vernier Photogate to the Vernier Centripetal Force Apparatus(CFA) 2. Connect the force sensor and the photogate to LabQuest. 3. Setup data a. Tap Mode. The default Photogate Mode►Motion works for this experiment. Select the User defined button. The distance to be entered is 1/10 of the circumference of the mass path. Because the radius in part 1 is 10 cm, this value should be 0.0628 m. b. To control when data collection stops, tap the option labeled “with the Stop button” in the field labeled “End data collection.” Tap OK. c. From the Graph menu select Graph 1. Change the axes of the graph so that it shows force vs. velocity. d. Tap the Meter tab. Lab Report Physics 4. Determine the mass of the sliding mass carriage. Add mass to both the sliding and fixed mass carriages as directed by your instructor. The mass of the sliding and fixed carriages should be the same so that the beam is balanced. Record the total mass of the sliding carriage and extra mass. 5. Position the fixed carriage so that its center is 10 cm from the axis of rotation. Adjust the position of the force sensor on the rail so that, when the line is tensed, the center of the sliding mass carriage is also at 10 cm. 6. Zero the force sensor 7. Spin the beam by twisting the knurled spindle of the CFA with your fingers. When the force reaches 3–4 N, begin collecting data. Let data collection continue for 20‑40 s. When you stop data collection, use the friction between your hand and the knurled spindle to stop the beam. 8. If your graph of force vs. velocity is not linear, create a “calculated column” that will enable you to obtain a linear graph (linearized graph F vs. 𝑣 2 step how to do this if you cannot do it by yourself.). Your instructor will explain step by step how to do this if you cannot do it by yourself. Part2: 1. Change the mass on both the fixed and sliding carriages and record the value of the total mass of the sliding carriage and any extra masses. 2. Re-zero the force sensor, then spin the beam as you did before. Once the force reaches 5–8 N, begin collecting data. When you stop data collection, stop the beam as you did in Part 1. 3. Change the system mass again and record the value of the total mass of the sliding carriage and any extra masses, then repeat Step 2. 4. Return the mass on both the fixed and sliding carriages to the original value used in Part1. Decrease the radius of both the sliding and fixed mass carriage by 2-3 cm. Record the value of the radius. Adjust the value of the User defined distance in the Mode window so that it is 1/10 of the circular path of the mass carriage. A warning will appear. Choose to discard the data. 5. Re-zero the force sensor, then spin the beam as you did before. Once the force reaches 5–8 N, begin collecting data. When you stop data collection, stop the beam. 6. Now, change the radius so that it is 2–3 cm greater than your initial value. Be sure to adjust the User defined distance as you did in Step 5. Record the value of the radius, then repeat Step 6 and 7. 7. Repeat step 8 of last section to linearize your last plots. Again, create a calculated column for 𝑣 2 Use this calculated column to plot F vs. v2 Lab Report Physics Result: First run In the first run, we put one mass on each side of Vernier centripetal force apparatus 10 centimeter (cm) far from the center point of the lever and spin the machine at the fore around 5-8 N .Observe the value of force, mass, velocity, and radius Looking at the graph force by velocity, show that as the velocity increases, the centripetal force we had measured was increasing exponentially. Later we had linearized the graph by altering the x-axis from velocity into velocity square (𝑣 2 ). We had found that centripetal force is proportional to 𝑣 2 and had calculated the slope of the graph is round up to 12.887. Second run In the second run, we put two masses on each side of Vernier centripetal force apparatus 10 centimeter (cm) far from the center point of the lever and spin the machine at the fore around 5-8 N .Observe the value of force, mass, velocity, and radius Lab Report Physics
