Newtons Second Law n..
advertisement
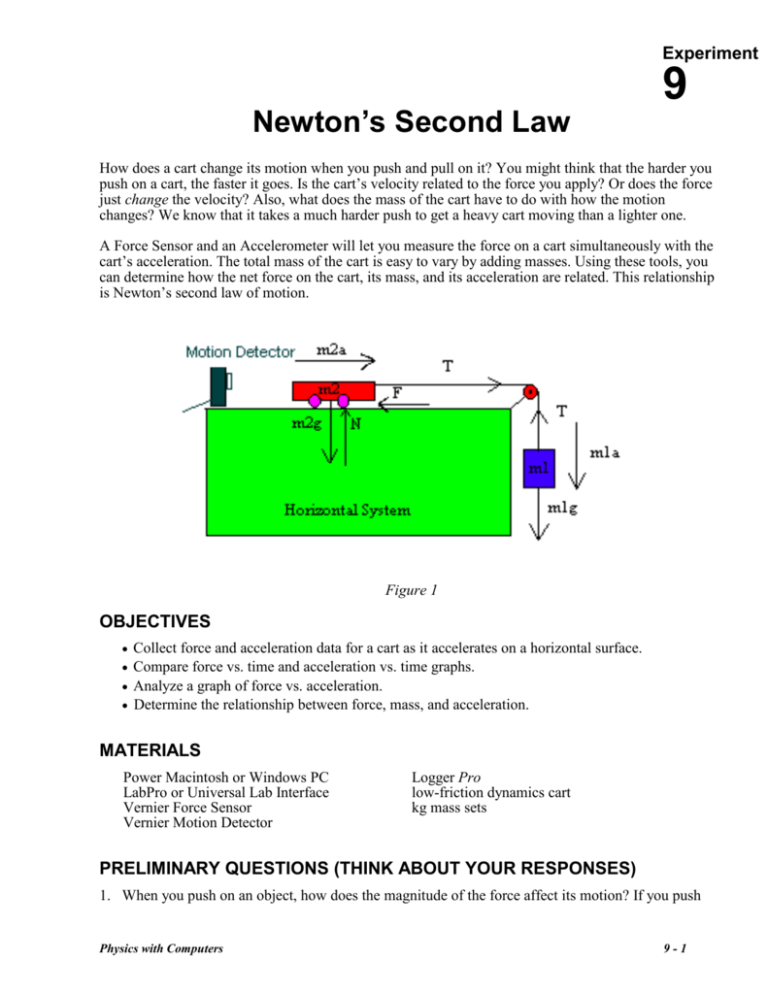
Experiment Newton’s Second Law 9 How does a cart change its motion when you push and pull on it? You might think that the harder you push on a cart, the faster it goes. Is the cart’s velocity related to the force you apply? Or does the force just change the velocity? Also, what does the mass of the cart have to do with how the motion changes? We know that it takes a much harder push to get a heavy cart moving than a lighter one. A Force Sensor and an Accelerometer will let you measure the force on a cart simultaneously with the cart’s acceleration. The total mass of the cart is easy to vary by adding masses. Using these tools, you can determine how the net force on the cart, its mass, and its acceleration are related. This relationship is Newton’s second law of motion. Figure 1 OBJECTIVES Collect force and acceleration data for a cart as it accelerates on a horizontal surface. Compare force vs. time and acceleration vs. time graphs. Analyze a graph of force vs. acceleration. Determine the relationship between force, mass, and acceleration. MATERIALS Power Macintosh or Windows PC LabPro or Universal Lab Interface Vernier Force Sensor Vernier Motion Detector Logger Pro low-friction dynamics cart kg mass sets PRELIMINARY QUESTIONS (THINK ABOUT YOUR RESPONSES) 1. When you push on an object, how does the magnitude of the force affect its motion? If you push Physics with Computers 9-1 Experiment 9 harder, is the change in motion smaller or larger? Do you think this is a direct or inverse relationship? 2. Assume that you have a bowling ball and a baseball, each suspended from a different rope. If you hit each of these balls with a full swing of a baseball bat, which ball will change its motion by the greater amount? 3. In the absence of friction and other forces, if you exert a force, F, on a mass, m, the mass will accelerate. If you exert the same force on a mass of 2m, would you expect the resulting acceleration to be twice as large or half as large? Is this a direct or inverse relationship? PROCEDURE 1. Open the Logger Pro Program. after plugging in the motion detector and force probe, you should see the graphs you need for this investigation 2. Connect a Dual-Range Force Sensor to Channel 1 on the LabPro Connect the Motion Probe to Dig/Sonic Channel 2 3. To get the best numerical results in the experiment, you may need to calibrate the force sensor f. g. h. i. j. a. Hang a 500 g mass vertically from the probe. If the reading is 4.9N, you may skip calibration. If not, go to (b). b. Choose Calibrate from the Experiment menu. c. Click the Force icon that appears in Channel 1. d. Click the button. e. Remove all weight from the Force Sensor and hold it vertically with the hook pointed down. Type 0 in the Value 1 edit box. When the displayed voltage reading for Input 1 stabilizes, click Keep . Add the 0.500 kg (4.9-N) mass to the hook of the Force Sensor. Type 4.9 in the Value 2 edit box. When the displayed voltage reading for Input 1 stabilizes, click Keep . a. When the displayed voltage reading for Input 2 stabilizes, click Keep , then click . You should check the calibration by measuring the weight of different masses. Find the mass of the cart with the Force Sensor. Record the mass in the data table. 4. Attach the Force Sensor to a dynamics cart so you can apply a horizontal force to the hook, directed along the sensitive axis of your particular Force Sensor. Next, attach the force sensor to its holder on the dynamics cart. Attach a string to the force Sensor and be sure it is long enough to connect to a slotted mass holder which should be hung over a pulley as shown in the figure.. 9-2 Physics with Computers Newton’s Second Law 6. Place the cart on a level surface. Make sure the cart is not moving and click . , then click Trials 7. You are now ready to collect force and motion data. Vary the FORCE acting on the cart (weight in the mass holder). Do not use too much force or the cart will move too quickly and the force calibration will not apply to your range. Protect the floor will a thin object ( an English or math text would do nicely-not your wonderful physics text) 8. Note the shape of the force vs. time and velocity vs. time graphs. Determine the acceleration of the cart by using the slope of v vs t. Determine the avg force during the interval of the acceleration. Highlight section and press “STAT”. Record the Force and acceleration in the data table. 9. Repeat to determine average Force and acceleration. You should have 3 values of each to compute averages. 10. Use a different force (weight) and repeat. You should have at least 4 different forces. An extra line has been added to the data table in case you need a 5th trial. 11. Open Graphical Analysis. Make a graph of Force(y axis) vs Acceleration (x axis). Determine if a relationship can be determined. 12. Increase the force and acceleration axis values so that you can extrapolate the line for large values of force. The acceleration axis should be taken out to a minimum of 12m/s/s and the force axis should be large enough to see the extrapolated line intersecting at 12 m/s/s.. In the last investigation, the line of best fit was extrapolated to sin90 as a straight line. If you believe the data would follow a different trend line for very large force values than predicted by graphically analysis, please draw it in. Physics with Computers 9-3 Experiment 9 Newton’s 2nd Law Group Names_____________________________________ Name_______________________ Data Table Data using cart Mass of Cart Hanging mass (kg) Trial 1 (N) Force Sensor Trial 2 Trial 3 (N) (N) kg Acceleration Average Force (N) Precision (N) trial 1 2 (m/s ) trial 2 2 (m/s ) Average acceleration (m/s2) trial 3 2 (m/s ) Precision (m/s2) QUESTIONS ( BE SURE TO USE COMPLETE SENTENCES) 1. What are the units of the slope of the force vs. acceleration graph? Simplify the units of the slope to fundamental units (m, kg, s). 2. What physical quantity does the slope of your Force vs Acceleration graph represent? You should be able to give a very specific answer. 3. Describe the relationship between force and acceleration by looking at the GRAPH and explaining the line you decided on. How can the line be extrapolated to include VERY LARGE Forces (weights)? If you believe the data would follow a different trend line for very large force values than predicted by graphically analysis, please draw it on your graph. 4. Write the equation to your graph and whether there is a limitation to its useful range. 5. Is there a discrepancy with what Newton’s 2nd law predicts? Explain why or why not. 9-4 Physics with Computers
