8.2 - Theoretical Probability and Tables of Outcomes - nwss
advertisement
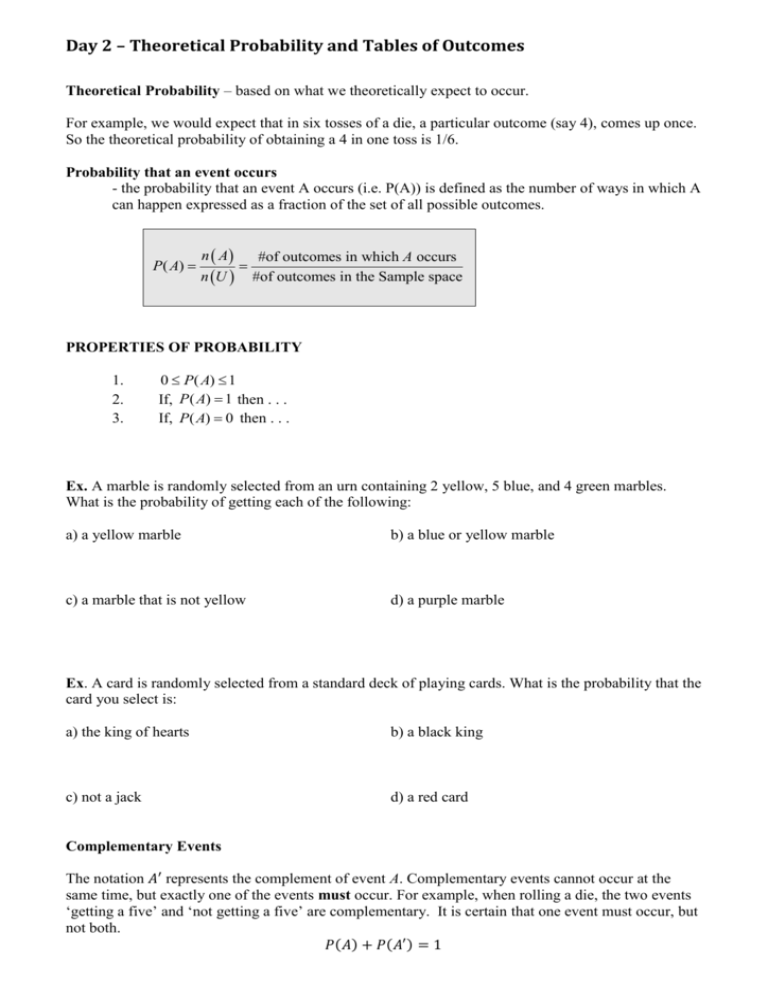
Day 2 – Theoretical Probability and Tables of Outcomes Theoretical Probability – based on what we theoretically expect to occur. For example, we would expect that in six tosses of a die, a particular outcome (say 4), comes up once. So the theoretical probability of obtaining a 4 in one toss is 1/6. Probability that an event occurs - the probability that an event A occurs (i.e. P(A)) is defined as the number of ways in which A can happen expressed as a fraction of the set of all possible outcomes. P( A) n A #of outcomes in which A occurs n U #of outcomes in the Sample space PROPERTIES OF PROBABILITY 1. 2. 3. 0 P( A) 1 If, P ( A) 1 then . . . If, P( A) 0 then . . . Ex. A marble is randomly selected from an urn containing 2 yellow, 5 blue, and 4 green marbles. What is the probability of getting each of the following: a) a yellow marble b) a blue or yellow marble c) a marble that is not yellow d) a purple marble Ex. A card is randomly selected from a standard deck of playing cards. What is the probability that the card you select is: a) the king of hearts b) a black king c) not a jack d) a red card Complementary Events The notation 𝐴′ represents the complement of event A. Complementary events cannot occur at the same time, but exactly one of the events must occur. For example, when rolling a die, the two events ‘getting a five’ and ‘not getting a five’ are complementary. It is certain that one event must occur, but not both. 𝑃(𝐴) + 𝑃(𝐴′ ) = 1 Ex. A die is rolled 3 times. What is the probability of getting: a) a 5 on all three rolls? b) at least one 5 on the three rolls? Mutually Exclusive Events - Two events are mutually exclusive if they can’t both happen at the same time For example, the events ‘getting a 2’ and ‘getting a 3’ are mutually exclusive when rolling a single die once. How are complementary events and mutually exclusive events different? Tables of Outcomes Tables of outcomes are used to compare two categorical variables and usually result from a survey. Ex. The following table represents the two variables ‘blood type’ and ‘Rh factor’. Blood Type Rh factor Postive Negative A A+ A- B B+ B- AB AB+ AB- O O+ O- Ex. A sample of children was surveyed about their ages and asked to choose their preferred location of play time (given two choices). The results are tabulated below. Play outside Play inside 3-5 years old 16 2 6 -8 years old 11 10 a) How many children responded to the survey? b) How many of the respondents were six years or older? c) How many children preferred to play inside or were 6-8 years old? c) How many of the children asked would prefer to play outside? d) What is the probability that the next child asked will choose to play inside? e) Estimate the probability that the next child asked will be five years or younger and prefer to play outside. f) Estimate the probability that the next child asked will prefer to play outside given that the child is four years old. Ex. A group of students was asked to respond to a survey about how they get to school each day. Male Female Bus 15 12 Walk 16 17 Car 8 9 Using the table, answer the following questions: a) How many of the respondents take the bus to school? b) How many students responded to the survey? c) Estimate the probability that a student is male, given that the student gets a car ride to school. d) Estimate the probability that a student is female and takes the bus to school. e) Estimate the probability that a student walks to school, given that the student is female.
